
Want to know how we help others in your industry?
What is Rheo-Impedance Spectroscopy?
Rheo-Impedance Spectroscopy (Rheo-IS) is a technique that simultaneously measures the electrical properties of a material whilst changing shear and temperature conditions, delivering a uniquely powerful window into its microstructure.
Uses & Applications
Electrical properties can be extremely sensitive to microstructural changes. The way a material conducts, resists, or stores an electrical charge reflects the arrangement of its constituent phases, the mobility of ions within it, and its internal interfaces.
Originally used mainly in the battery industry for the characterisation of electrode slurries, where conductive network integrity under processing conditions is essential, Rheo-IS has proven to be a remarkably versatile technique. At the Centre, we have extended its application well beyond this, developing applications across emulsions, surfactant systems, suspensions, and other complex fluids.
What we do
Helping you uncover a deeper level of microstructural insights:
Differentiate between interfacial microstructures
Identify shear-induced instabilities in emulsions and complex fluids
Detect conductive network formation, breakdown, and recovery under shear
Optimise filler or polymer content for electrical performance in functional materials
Discover how we exploit rheo-impedance spectroscopy for your industry.
Rheo-IS Resources
Do you want to explore rheo-impedance spectroscopy measurements for your samples?
Background
How Rheo-IS Works
Simultaneous Impedance and Flow Measurements
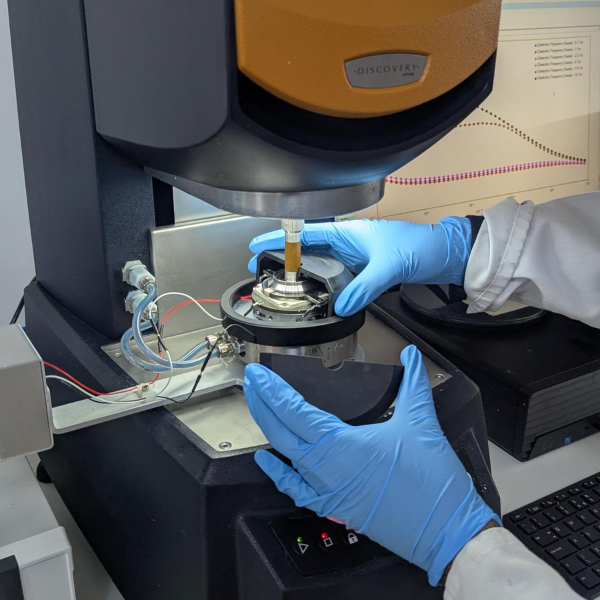
Rheo-IS uses a specialist electrode geometry built into the rheometer plate. One plate rotates relative to the other to apply steady shear to the sample, while a small alternating electrical current is simultaneously applied across the electrodes. The resulting impedance spectrum captures the material’s resistance and reactance across a range of frequencies.
The data is typically presented as:
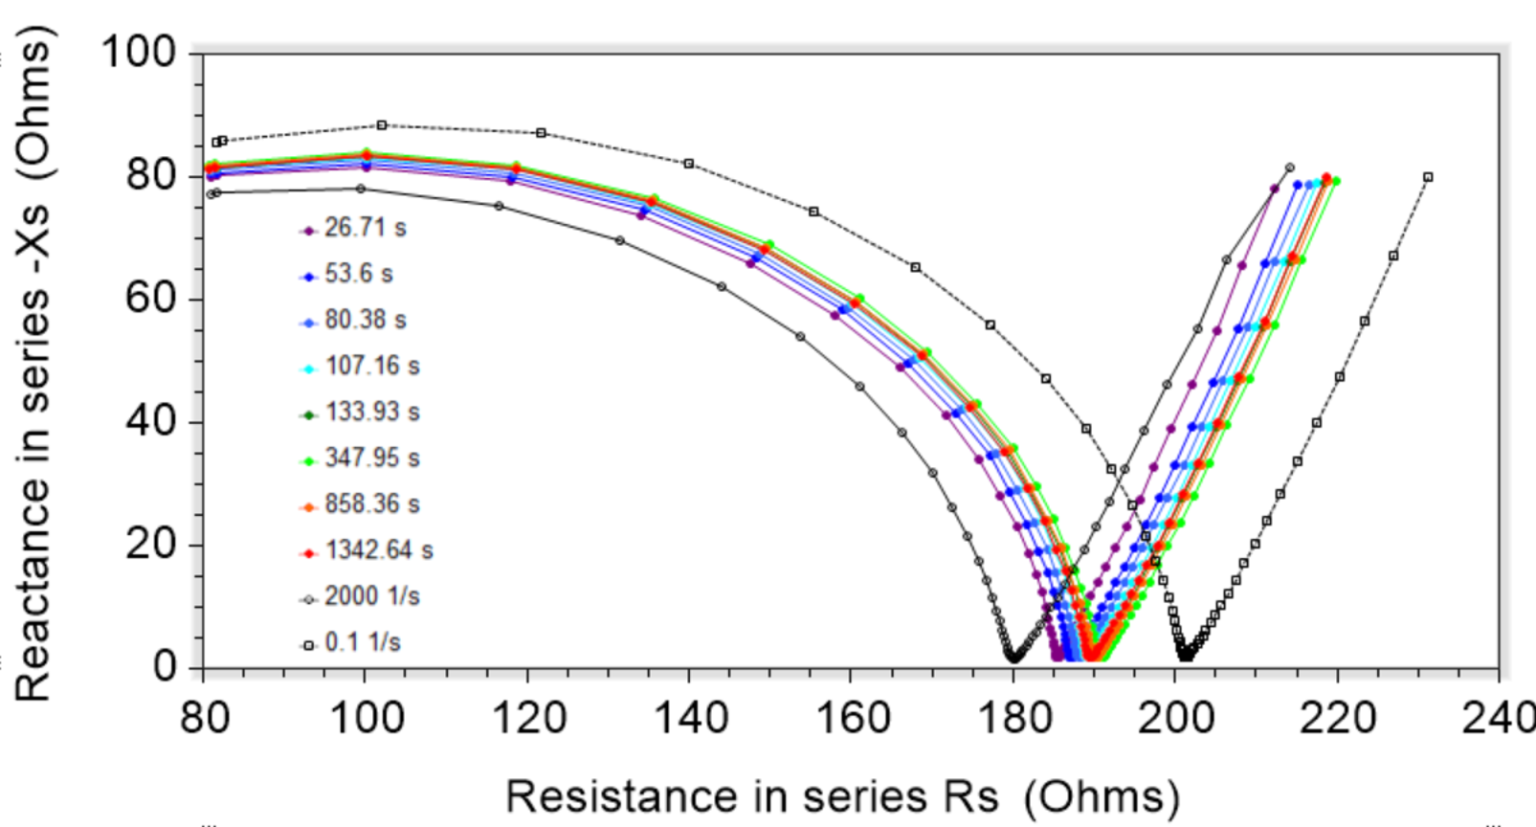
Nyquist Plots - Reactance plotted against resistance, revealing the resistive and capacitive nature of the material
Bode Plots - Impedance and phase angle plotted against frequency, giving a clear picture of frequency-dependent behaviour
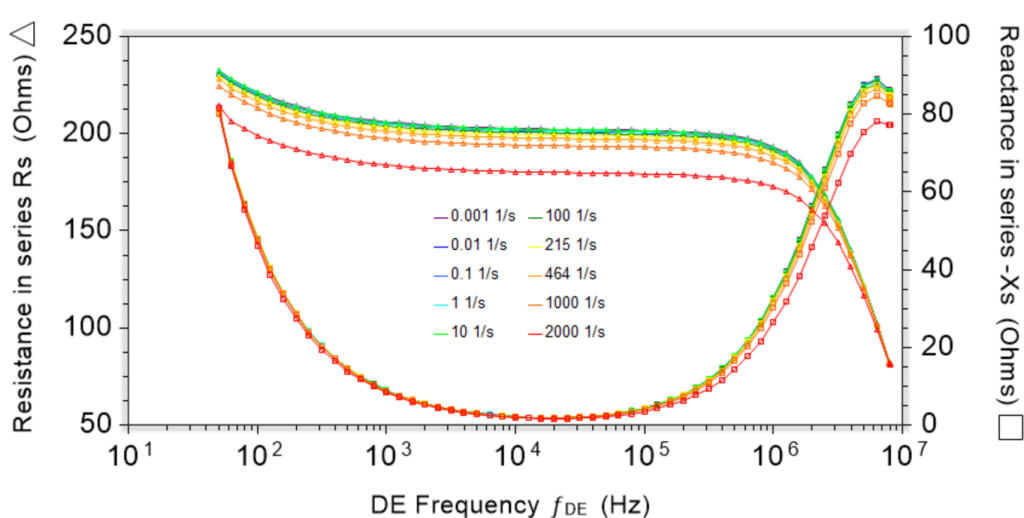
Rheologists will notice the parallels here: The Nyquist plot reflects the Cole-Cole plot of loss modulus vs storage modulus, and the Bode plot parallels complex modulus and phase angle graphed against frequency.
The results obtained can reveal a whole new level of materials insights.
A Closer Look Into Applications
Shear-Induced Instabilities
Identifying Shear-Induced Instabilities in Complex Materials
Complex materials and emulsions can undergo structural instabilities when subjected to shear. These include shear-induced phase separation, where shear forces drive the partial separation of dispersed and continuous phases. The onset of these instabilities can be difficult to fully characterise from rheological data alone.
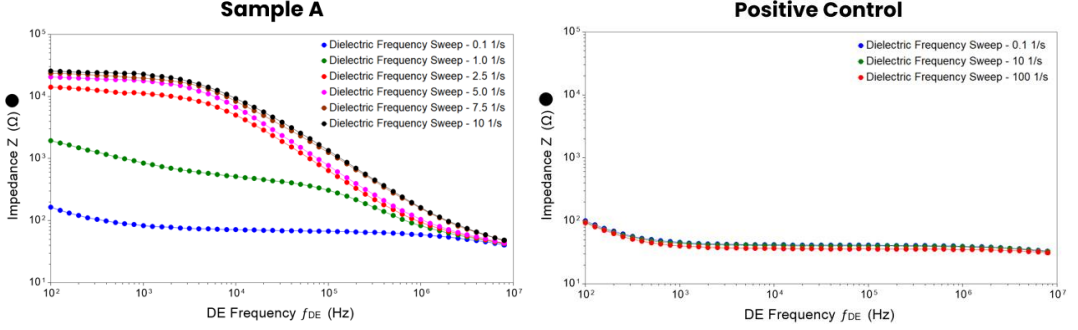
Rheo-IS is sensitive to these events. Phase separation alters the conductive pathways available within the continuous phase, producing measurable changes in impedance. Rheo-IS therefore can help to provide a more complete picture of emulsion behaviour under process-relevant conditions, supporting both formulation development and stability screening.
A Closer Look Into Applications
Microstructural Differentiation
Distinguishing Interfacial Structures in Surfactant Systems
Surfactant systems can adopt very different microstructures – lamellar phases, worm-like micelles, vesicles – that are not always distinguishable by rheology alone. Two formulations may exhibit similar viscoelastic profiles yet possess fundamentally different microstructures with distinct stability and performance implications.
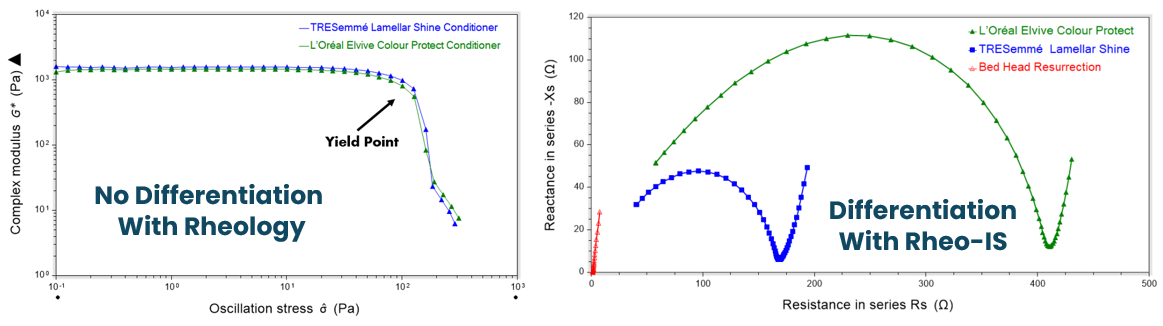
Rheo-IS can differentiate between these structures through differences in their impedance fingerprints.
Upon receipt of your samples, we will:

Measure
Perform measurements of the electrical properties (impedance, resistance, reactance, conductivity) relevant to your products as a function of shear or temperature.

Present
Present and explain the results, discussing the insights gained with reference to your specific needs.

Support
Provide the support necessary to exploit the analyses and confidently communicate and discuss the findings.
Other techniques & capabilities
Find out more about our other techniques and capabilities by following the links below.