
Want to know how we help others in your industry?
What is Foam Analysis?
The study of foamability, foam stability and bubble structure.
On This Page:
Uses & Applications
Ease of foam formation, the stability of that foam and its bubble size distribution are often critical attributes for many products. Plant-based milks need to foam as well as their dairy counterparts for baristas. Shampoos need to retain a creamy lather in the hardest of waters, and lubricants must suppress foam formation to maintain effectiveness.
How We Help You
The Benefits Foam Analysis Testing Holds
Dynamic foam analysis equips the researcher with quantified, repeatable and objective insights into these properties. We analyse your foam’s physical properties, providing insights into its durability and comfort. This enables you to optimise your product design and deliver high-quality goods that stand out in the market.
Find out how our foam analysis experts can support your industry.
Industries
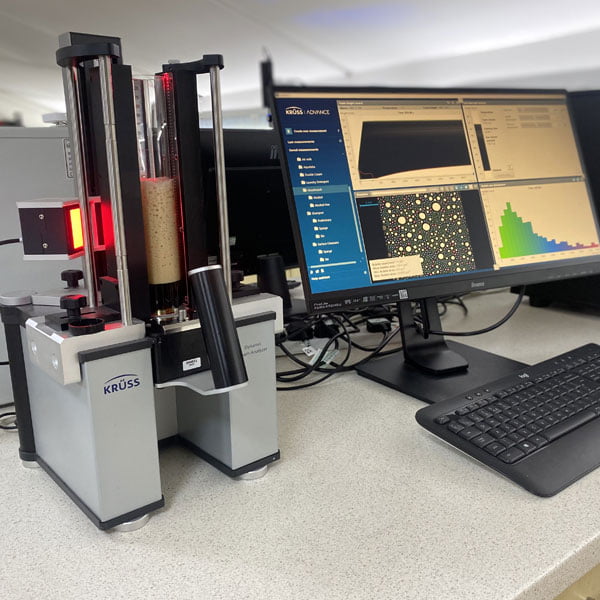
Dynamic Foam Analyser
Looking for expert foam sample analysis for your organisation?
Our Methods
How to Analyse Foamability, Stability and Structure
Foamability, the ease of foam generation, is measured by the height of foam generated under defined conditions.
Foam stability is quantified by measuring its drainage, and in the case of very unstable foams, top-down bubble burst.
Foam stability and texture are also characterised by bubble structure, size and size distribution.
Generating foam
During testing, we generate foam under defined conditions by sparging (passing air through a filter plate) or stirring with either a whisk head or dual-blade head.
Foams can also be generated manually following some relevant process of the instrument and loaded onto the instrument for analysis.
Determining the liquid and foam fractions
Foam analysis uses light transmission to determine the liquid and foam fractions in the glass column. The foam height module operates on the principle that air and transparent or translucent liquid let light pass while foam blocks it. This allows the photodetector to detect the liquid, foam and air phases and boundaries.
Foam decay
There are two types of decay measurable using a light sensor module: drainage and bursting/evaporation. The mechanisms of degradation differ with time and from sample to sample.
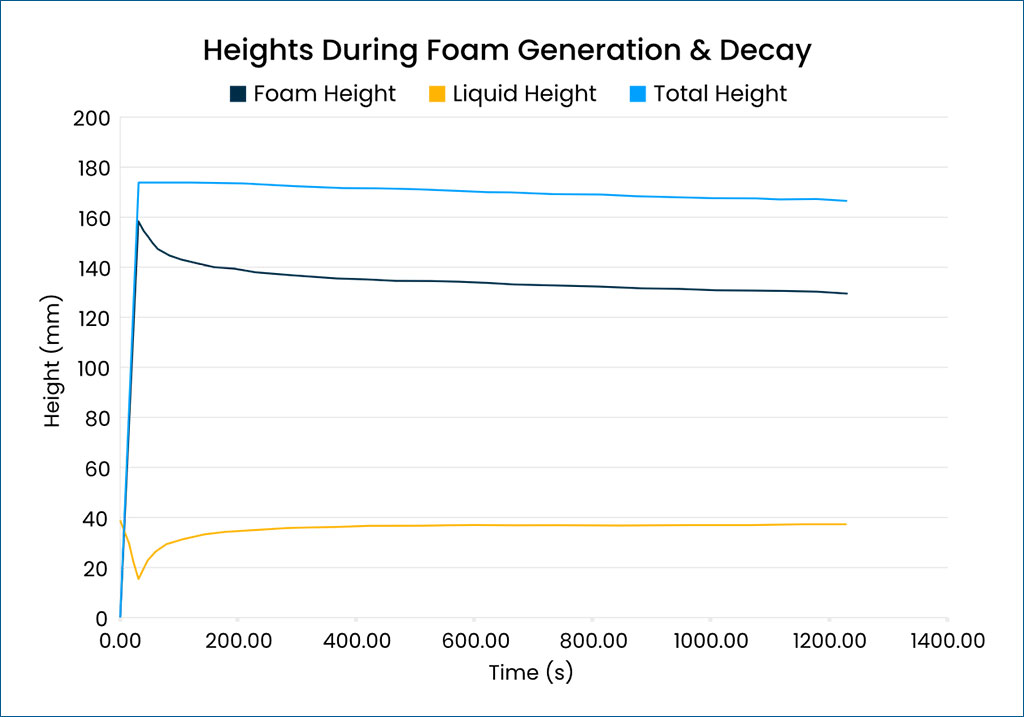
Foam decay due to draining can be seen when the total height remains constant, but the foam height decreases. It is caused by the liquid fraction increasing as the liquid drains from the foam. Thus, draining can be measured by assessing the increase in height and volume of the liquid fraction over time.
Conversely, foam decay from bursting or evaporation is evidenced when there is a concurrent decrease in both total height and foam height.
Which metrics are associated with foam generation and decay?
Metrics associated with foam generation and decay are as follows:
Generation (foamability): Foam height (total height – liquid height)
Decay (foam stability): Draining half-life (from liquid height) and foam half-life (from foam volume)
Other metrics: Foam volume (height x area) and gas volume used for foaming.
Below is an example data plot showing foam, liquid and total height of foam during generation and decay.
Assessing Bubble Size
Imaging Foam Structure
Another foam stability testing approach is to measure the change of bubble size with time. Bubbles of a less stable foam will coalesce to fewer, larger bubbles at a greater rate than those of a more stable foam.
For this, we use the structure module of our foam analyser. It consists of a prism column and a camera positioned orthogonally to an LED light source. The foam in the column has a thin liquid film between the bubbles and the prism.
The bubbles press against the prism, forming a gas-liquid interface parallel to the prism-liquid interface. As the camera only detects light leaving the prism at a 90° angle to the LED, light from curved areas is not seen. No effects from second-layer bubbles are observed, meaning well-resolved sharp images are generated.
Tracking changes in bubble size distribution
The images captured are time-resolved, so changes in foam structure over time can be observed. We can pull out individual, time-stamped images or generate structure evolution videos to facilitate this.
Our foam analysis software produces time-resolved histograms, which demonstrate whether a foam is homo or heterogeneous and if this changes with time. Other metrics which can be determined include mean bubble area and bubble count, which provide further foam stability measurements.
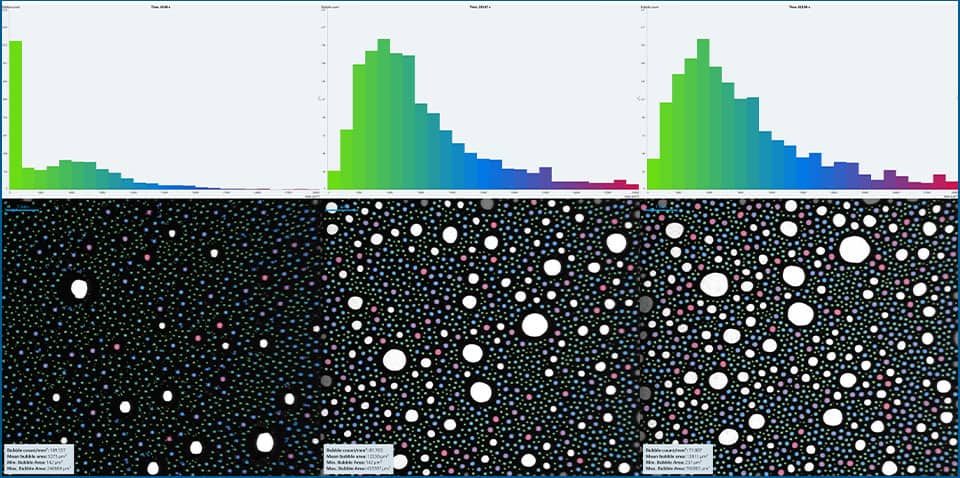
Above: The top image shows example histograms displaying change in bubble size distribution of a foam over time. The bottom image shows examples captured from our foam analyser displaying foam structure changes over time, colour-coded to the histogram bins above.
Explore the industries we support and learn if we can help your organisation
Upon receipt of your samples, we will:

Measure
Perform measurements of the appropriate properties (foam formation, texture, stability/half-life, bubble size distribution, etc) of relevance to your products and processes.

Present
Present and explain the results, discussing the insights gained with reference to your specific needs.

Support
Provide you with the support necessary to maximise the potential of the analyses and confidently communicate and discuss the findings.
Other techniques & capabilities
Find out more about our other techniques and capabilities by following the links below.