
Want to know how we help others in your industry?
What is Rheology Testing?
Rheology testing involves observing a material’s response to the application of stresses and strains to elucidate viscosity and viscoelastic properties.
Just need a viscosity value? See Viscosity Testing →
On This Page:
Uses & Applications
For many data-hungry product developers, their first rheology profiles can unearth a treasure-trove of physical properties that guide their next steps.
Getting rheology right is often paramount for bringing winning products to market. The proper rheology delivers critical processing, stability, texture and performance attributes for pharmaceuticals, foods, cosmetics, building materials, coatings, and more.
What we do
Understanding the rheology of your products and those of your competitors can help you:
Predict suspension or emulsion stability
Reformulate with alternative ingredients
Benchmark against their competitors and reverse engineer to a target or reference formulation
Understand the impact of processing and filling on the final product
Predict sensory and texture properties to reduce dependence on sensory panels
Discover how our rheology testing expertise helps your industry.
Industries
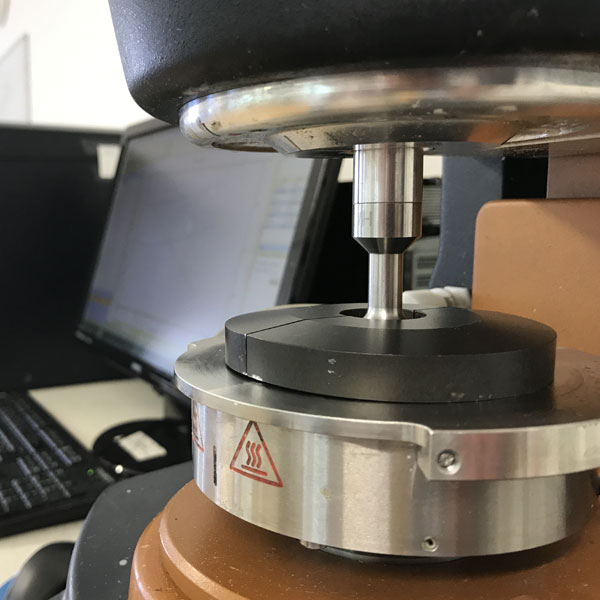
High performance rheometers deliver a vast wealth of materials insights, well beyond those obtained from simple viscosity tests.
Do you need a rapid rheology measurement of your or your competitor’s products?
Rheology Measurement Methods
Start with a Rheology Snapshot…
For a super-quick insight into overall rheology properties, a “rheology snapshot” is a great starting point, delivering simple yet powerful insights for your product.
Many materials, such as suspensions, emulsions and gels, can be thought of as structured liquids. They have a soft-solid structure but can easily be made to flow like a liquid. The rheology snapshot captures the structure and flow properties of a sample:
Measuring Structure
Oscillatory stress or strain sweeps gently probe a sample’s microstructure. Structure results are delivered as the storage modulus (G′), loss modulus (G″), complex modulus (G*) and phase angle (δ), along with the yield stress, which indicates the strength of the structure.
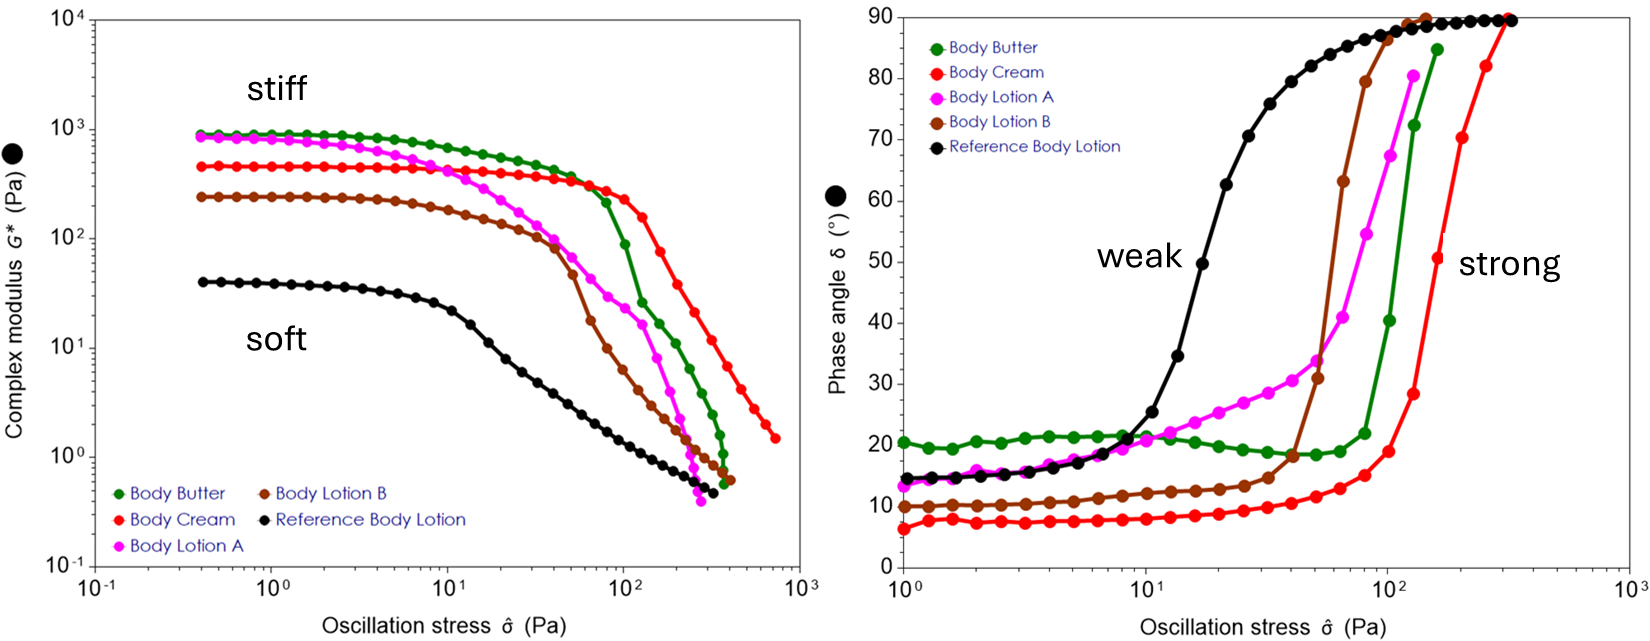
Oscillatory stress sweeps deliver structure rigidity from the complex modulus (G*, left) and solid-like or liquid-like character from the phase angle (δ, right), with yielding visible on both plots.
Measuring Flow
Viscosity measurements are performed across a range of shear rates to capture any non-Newtonian flow behaviour. Viscosity results are typically reported in units of Pascal seconds (Pa.s) or centiPoise (cP).
We can run the profile at controlled shear rates, to mimic pumping, mixing and filling, or at controlled stresses, to mimic gentler forces such as settling and levelling. Our Viscosity Testing page covers both in more detail.
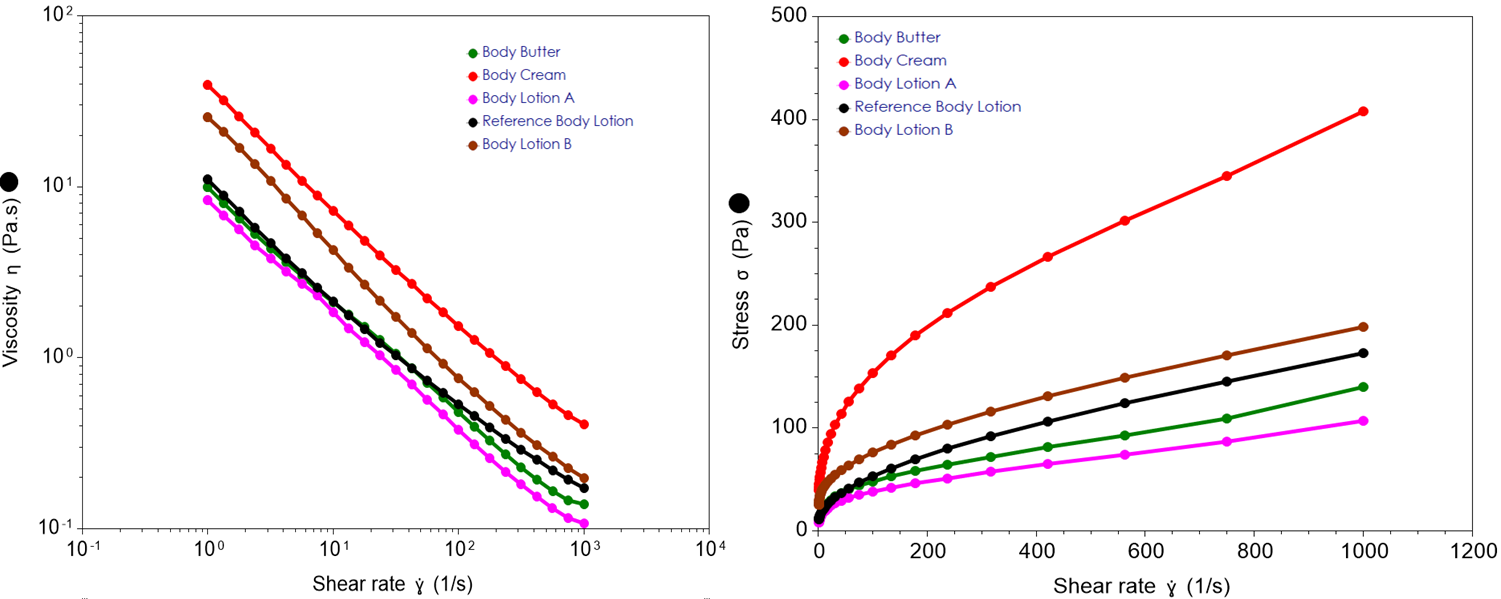
Viscosity vs shear rate (left) and shear stress vs shear rate (right), covering a wide range of shear conditions.
The results are easy to understand and interpret.
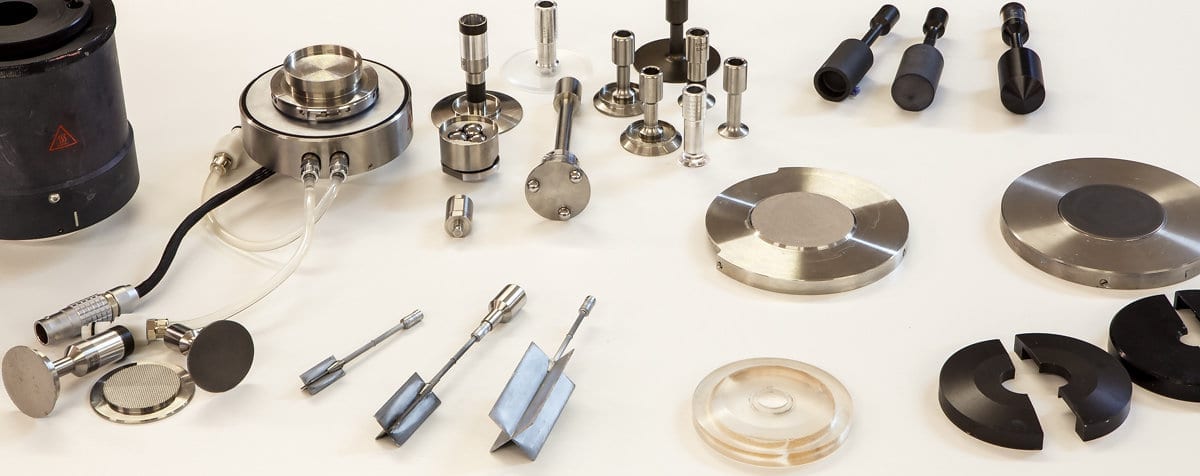
A selection from our range of measuring accessories, including custom-built attachments that enable us to meet specific needs.
A Closer Look
Then choose a deeper rheological analysis…
Viscoelasticity
Viscoelasticity analyses can predict behaviours that lead to handling and appearance properties, lubricity, stringing and tailing, film formation and potential pumping issues. Small angle oscillatory shearing, also known as dynamic rheological profiling, delivers storage (or elastic) modulus (G′), loss (or viscous) modulus (G″), phase angle and/or tan delta measurements. Normal stress measured under shearing can predict the extensional rheologies that lead to long, stretchy textures and processing and filling problems.
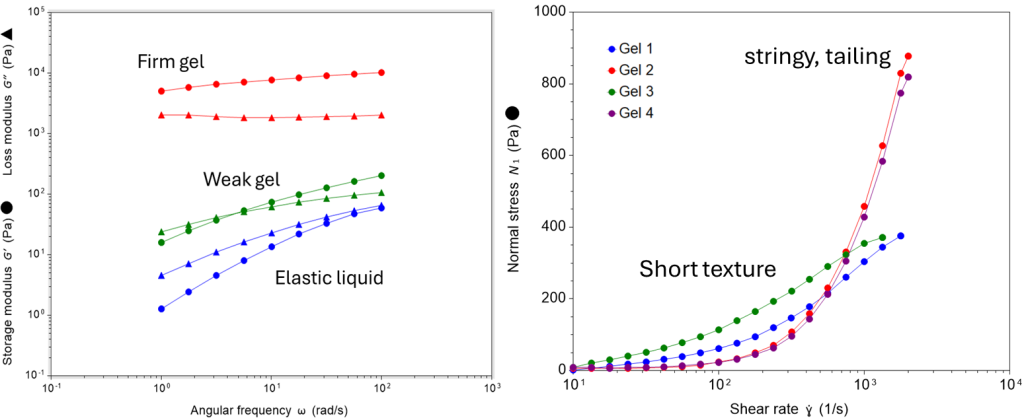
Viscoelasticity can be characterised through oscillatory frequency sweeps (left) and normal stress measurements (right).
Zero-shear viscosity
This special case of viscosity predicts the mobility of suspended particles or emulsified droplets when a material is in an almost at-rest condition. The measurement takes place at incredibly low rotational rates (as low as one revolution in three months!) but only takes half an hour or so to perform. The zero-shear viscosity is taken from the plateau that forms at the lowest stresses, and is reported in Pascal seconds (Pa.s) or centipoise (cP).
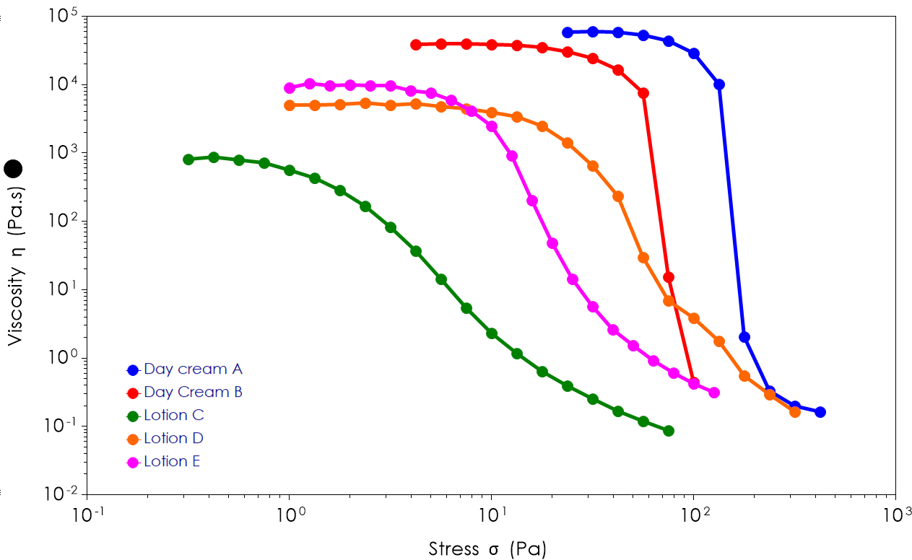
Zero-shear viscosity plateaus, clearly observable at low stresses, can be valuable in assessing the mobility of dispersed droplets or particles under near-storage conditions.
Thixotropy analyses
Thixotropic materials are those that show a time-dependent viscosity change following either the application or the cessation of shearing. Thixotropic liquids typically include suspensions and emulsions, where the breakdown and subsequent recovery of colloidal structures are not instantaneous but take time to progress to a new equilibrium state.
The most commonly required output of a thixotropy measurement is a quantification of the “thixotropic recovery rate”, the time taken for viscosity to rebuild to an acceptable level after shear is removed. This determines, for example, the ability of a coating or ink to maintain position following application, or the ability of an adhesive to “grab” and maintain contact whilst a cure proceeds. The “thixotropic breakdown rate” is also of interest in situations such as pump or process start-up, where the assembled structure is to be disrupted to initiate flow, and the application of products to the skin, where a protracted thixotropic breakdown can result in poor spreadability.
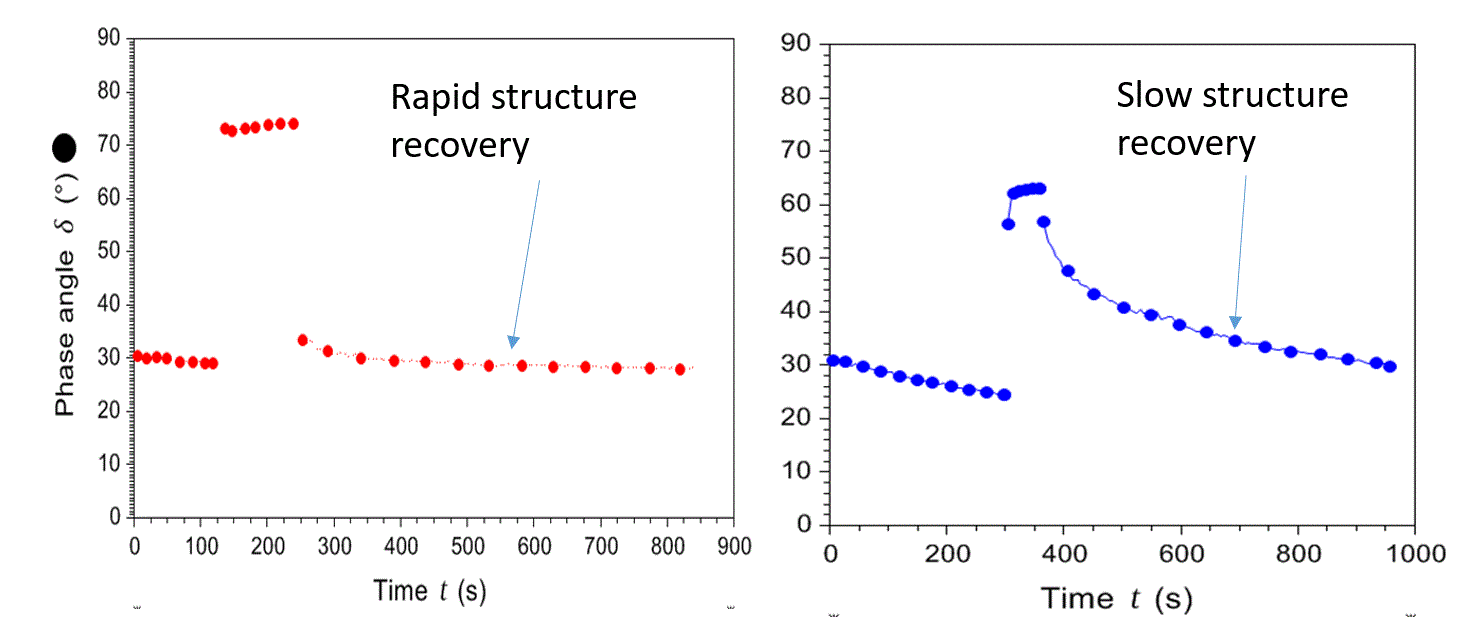
Structure recovery after shearing: rapid (left) and slow (right) thixotropic recovery.
Temperature profiling and cycling
For materials that undergo phase changes such as melts and crystallisations, oscillatory temperature sweeps can provide thermorheological fingerprints that are excellent for benchmarking and second-sourcing waxes and hydrocarbon-based products. For starch slurries that gelatinise, or thermoset adhesives and resins that undergo gelation and curing, oscillatory temperature sweeps or isothermal time sweeps enable the easy identification of key points such as viscosity minima, cure times and gel points. Furthermore, accelerated ageing can be investigated with cyclic oscillatory “swing” tests, which cycle the sample through storage temperatures.
Our Peltier plates reach 200 °C and our Environmental Test Chamber reaches 500 °C, so we can also measure polymer melts, glass transitions and thermoset cure.
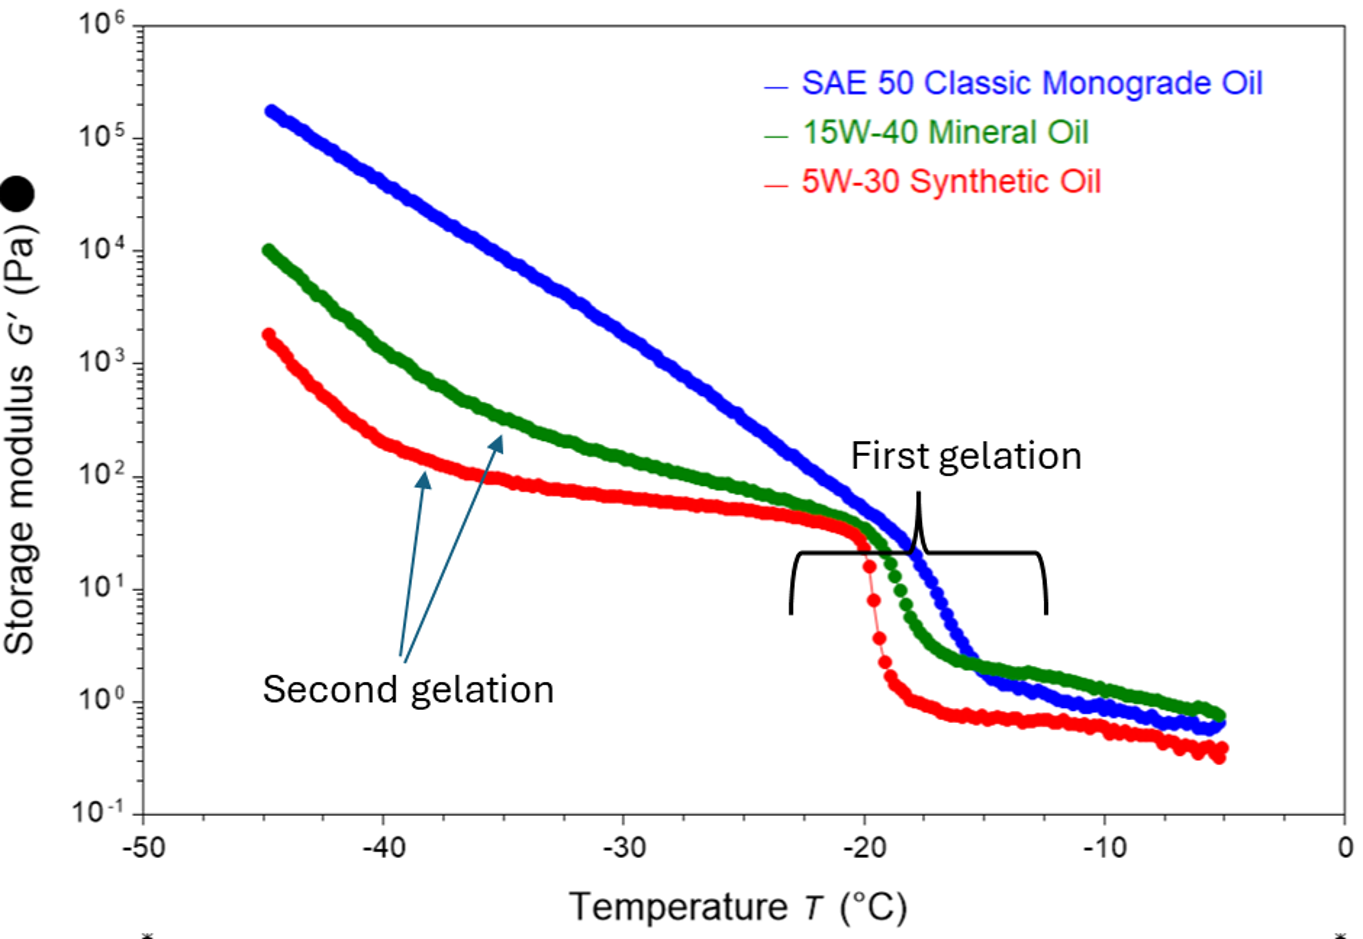
Thermorheological profiling, using oscillatory temperature sweeps, reveals melting, gelation and crystallisation processes. Gelation of oils on cooling shows as an enormous growth in storage modulus.
Creep and recovery
Creep testing delivers strain or compliance measurements as a function of time under very low stresses. Creep testing is often employed as a means for obtaining zero-shear viscosity but can also provide rapid indications of the propensity for materials to sag or slump following deposition and application.
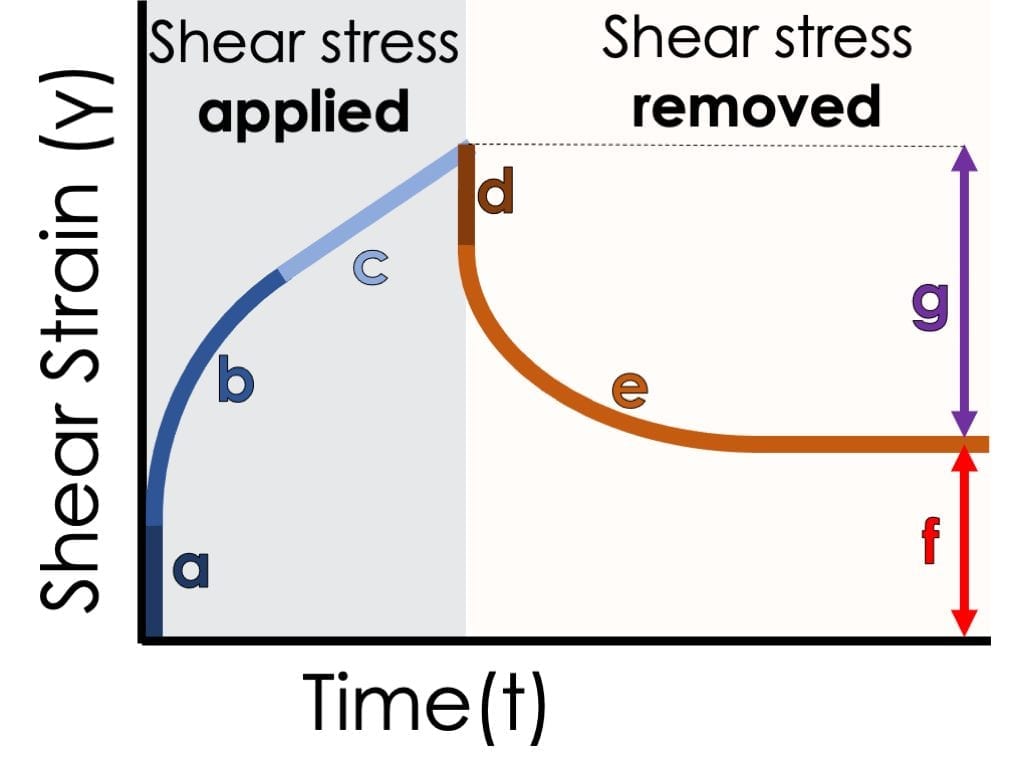
A small, constant stress is applied and the strain followed over time. Removing the stress shows how much of the deformation recovers.
Need to go further?
We also pair rheology with specialist accessories, from rheo-microscopy and rheo-impedance spectroscopy to capillary rheology and DMA, to unlock insights conventional testing cannot reach.
Advanced Rheology
Just need a viscosity value?
Our Viscosity Testing page covers flow curves, viscosity across a range of temperatures and rapid-turnaround Brookfield viscometer testing.
Viscosity Testing
Upon receipt of your samples, we will:

Measure
Perform appropriate measurements of the properties (viscoelastic moduli, viscosity, yield stress, etc.) relevant to your products.

Present
Present and explain the results, discussing the insights gained with reference to your specific needs.

Support
Provide the support necessary to exploit the analyses and confidently communicate and discuss the findings.
On completion of testing you will receive a full report, including graphics, data tables and explanations. Every report includes ongoing Q&A support for interpretation or application of the results.
Other techniques & capabilities
Find out more about our other techniques and capabilities by following the links below.