 Crispiness is a crucial sensory attribute for snack foods, significantly influencing consumer perception. Traditionally assessed through sensory panels, crispiness can be quantitatively measured through acoustic analysis, providing objective and repeatable results. This case study illustrates the application of acoustic analysis to evaluate crispiness in crisps.
Utilising our TA.XTplusC universal tester and texture analyser, we can compress a defined mass of a sample to conduct acoustic analysis during the compression process. Translating this raw audio into meaningful, repeatable data is our specialty. Our extensive experience allows us to manage the entire process for you.
We design tailored test methods by selecting the perfect combination of accessories, microphone placement, and signal processing to suit your samples. In addition to this, our acoustic analysis capabilities are extremely versatile, utilising our own custom microphone setups to adapt analysis based on the specific application.
Contact the lab to discuss your characterisation requirements
Contact us
Acoustic Analysis of Crisps
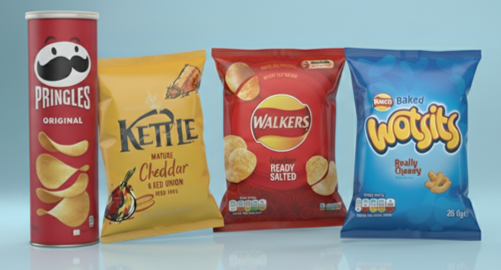
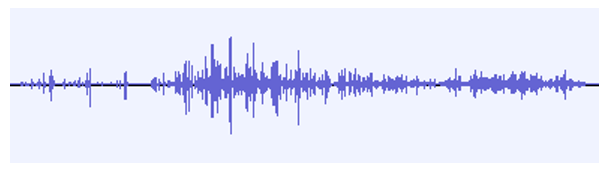
Four crisp samples were selected to quantify the crispiness between them. Crisps were subjected to compression utilising our texture analyser fitted with a specialised crushing accessory. In this study, we used our versatile custom microphone setup to capture acoustic emissions produced during crushing. Acoustic signals were then processed using acoustic analysis software, applying a high-pass frequency filter to eliminate background noises such as equipment vibrations, air conditioning sounds, and electrical mains hum.
The processed acoustic data was quantified by calculating the Root Mean Square volume in decibels (dB). These values, inherently negative, indicate the intensity of fracture events, where larger negative values correspond to lower volumes and decreased crispiness. To improve interpretability, the reciprocal of the absolute RMS values was computed and multiplied by 1000, creating an intuitive crispiness index, where higher values correlate to greater crispiness. To facilitate a more robust comparison, these values were then statistically normalised to a 0-100 scale, with the scale’s range defined by the statistical properties of the entire dataset.
Crispiness Quantification of Crisps
Clear differences in crispiness were observed between the crisp samples following acoustic analysis. Kettle crisps demonstrated the highest level of crispiness, which aligns with expectations given their premium, hand-cooked nature and higher price point. This enhanced crispiness can contribute to a more luxurious sensory experience.
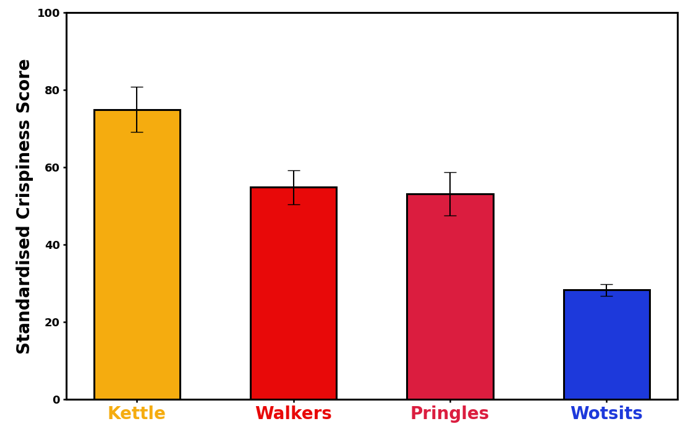
Both Pringles and Walkers crisps displayed similar crispiness profiles. In contrast, the Wotsits showed the lowest crispiness, which is consistent with their intentionally airy, melt-in-the-mouth texture.
This case study demonstrates how acoustic analysis can be used to benchmark and quantitatively measure crispiness in snack foods. By capturing and processing sound emissions during controlled compression, we can establish a crispiness index that successfully differentiates between products. Unlike sensory panels, this method provides objective, repeatable, and quantifiable data.
Summary
While this case study focuses on crisps, our acoustic analysis capabilities extend beyond this specific application. If you require acoustic analysis for any other need, do not hesitate to contact us to learn more about how we can support your needs.

Related Articles;
Flow to Flavour: Dynamic Powder Analysis for Optimising Seasoning Coating
Texture Profile Analysis of Animal vs Plant-Based Protein Products
Wasif Altaf serves as an Applications Specialist at the Centre for Industrial Rheology, leveraging a chemical engineering background (BEng) to bridge theory and practice. His work focuses on advanced rheological characterisation.