 Investigating the rheology of adhesives can help manufacturers and customers alike better understand how to pick and choose the best adhesives for their application.
Peel, tack and grab, shear/creep resistance and elasticity can be explored and quantified using an appropriate toolkit of rheological techniques.
We offer flexibility in testing, training, and consulting on the rheology of adhesives. If you’d like to arrange a discussion with our experts, please feel welcome to contact our technical team, arrange a tour of the lab and get the help you need.
Contact our lab to learn about our testing, training, and consulting services for the adhesives industry
Jump to the relevant bits:
-
Viscosity Testing of Adhesives – Handling and stability
-
Dynamic Oscillatory Testing – Measuring Viscoelasticity
-
Dynamic Time Sweep – Curing and Shrinkage
-
Dynamic Temperature Ramp – A highly versatile and informative test for adhesive characterisation, particularly Pressure Sensitive Adhesives (PSAs)
-
Comparing Molecular Properties – Molecular Weight, Molecular Weight Distribution and Crosslinking
-
Dynamic Frequency Sweeps and Time-Temperature Superposition
-
Creep Test – Direct measurement of cold flow behaviour and compliance
-
Axial Tests – tackiness, peel, adhesion, cohesion, and ASTM D2979
Adhesives are used across multiple industries to bond two substrates together permanently or over a targeted time frame. These come in various forms, from bandage adhesives that attach sterile coverings to skin until a wound is healed to carpenter’s glue used to bond wood together to multi-functional adhesives that simultaneously join two substrates and act to seal and protect the join from environmental damage.
Therefore, it is vital to quantify and compare the performance of adhesives to ensure that they are suitable for their intended application and behave as expected under typical use conditions. Rheology testing of adhesives is a staple for formulators and engineers looking to understand adhesive behaviour and best identify features and traits that benefit their application.
Viscosity Testing of Adhesives – Handling and stability
Viscosity tests are often the only type of rheological test within reach for many adhesives manufacturers looking to understand the performance of their adhesives. Solution viscosity and melt viscosity are two standard metrics used within the adhesives industry. Viscosity determines how the material handles and its long-term stability– with higher viscosity materials being more difficult to pump, spray, mix or apply and low viscosity materials being more prone to phase separation and sedimentation.
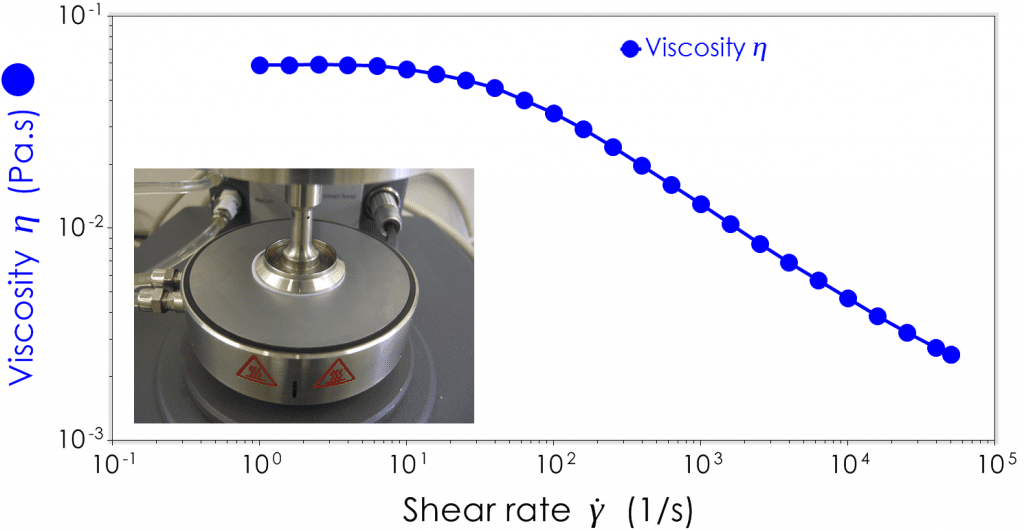
Non-Newtonian adhesives can lead a ‘double-life of viscosity, changing their handling behaviour based on the shear they are subjected to. Generally, shear-thinning non-Newtonian behaviour is most common, with samples displaying a high viscosity under low shear (such as when under storage) and a low viscosity during high shear (such as when being pumped, coated, or sprayed). Shear rate sweeps are the most helpful test when understanding handling behaviour from pumping, mixing, and coating.
Dynamic Oscillatory Testing – Measuring Viscoelasticity
Oscillatory testing is a staple of the adhesive rheology lab, helping to provide detailed information about the structural properties of a material in a minimally disruptive fashion. Oscillatory testing can be thought of as a form of mechanical spectroscopy that involves applying small amplitude oscillatory deformations to a sample and measuring the stress responses i.e., gently wobbling the sample and seeing how much it resists being deformed.
Oscillatory testing can be performed in several different ways providing key metrics such as:
-
-
-
-
- G*, Complex modulus – a measure of the overall resistance to deformation
- G’, storage/elastic modulus – a measure of the elastic or recoverable deformation strength of the material
- Often used as a measure of cohesive strength
- High G’ at high frequencies typically indicates a high peel strength
- High G’ at low frequencies typically indicates a high shear resistance
- G”, loss/viscous modulus – a measure of the viscous or non-recoverable deformation strength of the material
- Often used as a measure of adhesive strength
- High G” at high frequency typically indicates a high peel strength at the interface
- High G” at low frequency typically indicates high adhesion shear resistance at the interface
- Tan ∂ – a measure of the dampening ability of the material
- Low tan ∂ = high cohesive strength
- High tan ∂ = high adhesive strength
- Tm, Melt transition – the melting point of the material
- Tg, Glass transition – the condition at which the material transitions from a hard and brittle glassy state to a soft and rubbery state
-
-
-
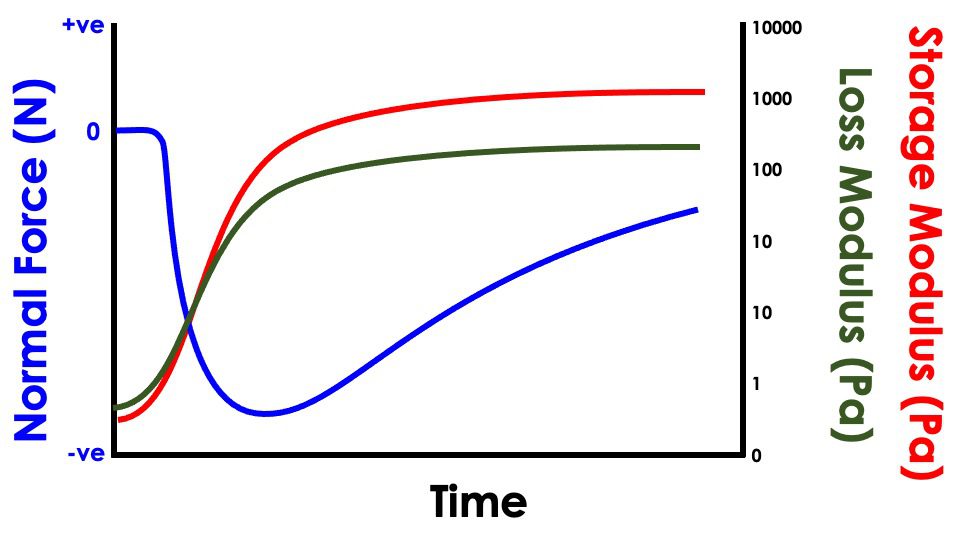
Dynamic Time Sweep – Curing and Shrinkage
Dynamic time sweeps or oscillatory time sweeps are used to track the development of structural properties in adhesives over time. They are popular for adhesives that cure or harden over time. The hardening of an adhesive can be due to chemical changes ongoing within the material, loss of solvent or cooling down over time. Some adhesives can be prone to shrinking during this period of hardening, reducing performance effectiveness – we can track the change in axial force or the change in the gap over time as the material hardens, giving an indication of shrinkage throughout the cure period.
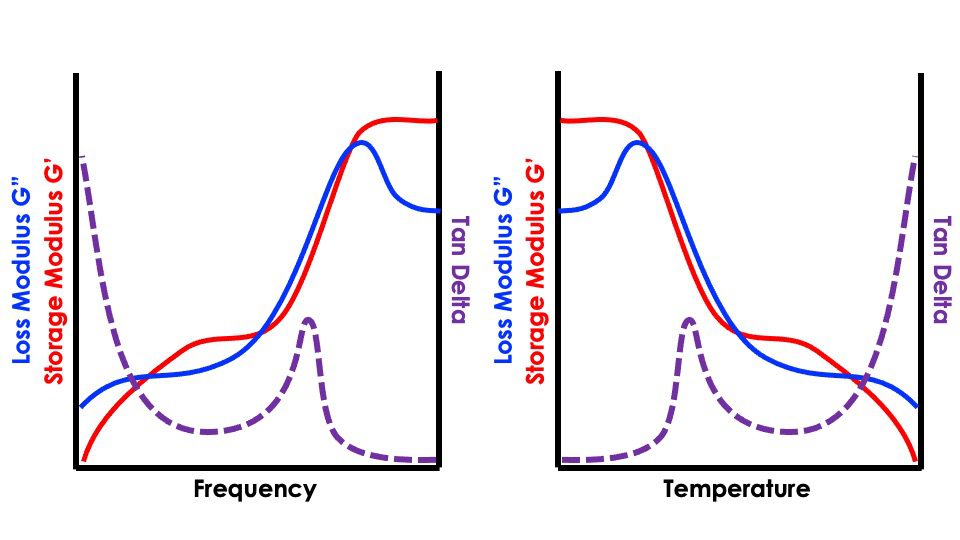
Dynamic Temperature Ramp – A highly versatile and informative test for adhesive characterisation, particularly Pressure Sensitive Adhesives (PSAs)
Dynamic temperature ramps or oscillatory temperature ramps are arguably one of the most valuable tests to perform when characterising the physical properties of an adhesive. The test is relatively simple and involves tracking changes in structure as a function of temperature.
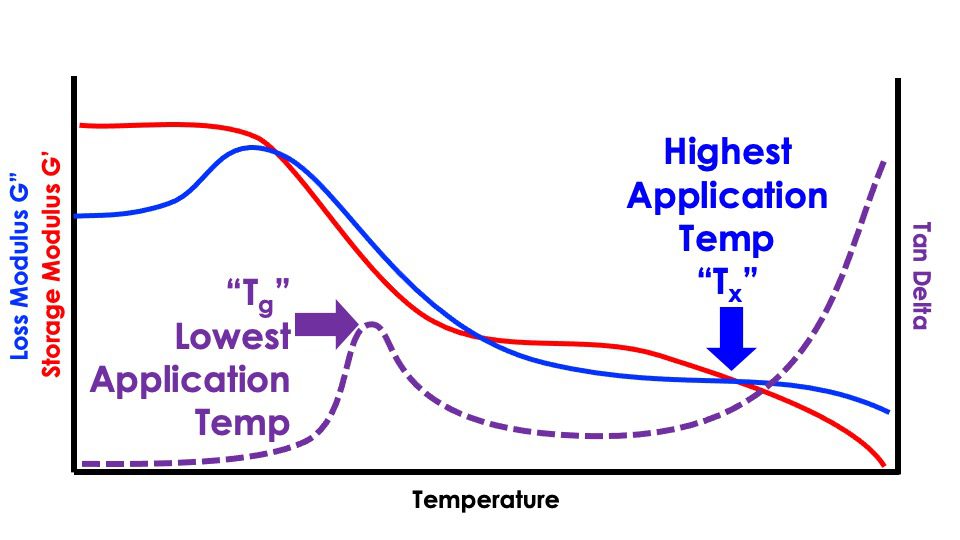
A plot of storage modulus, loss modulus and tan delta as a function of increasing temperature.
The glass transition (Tg)of an adhesive, taken as the peak of tan delta in the plot above, indicates a structural change in the material as it transitions from a hard, brittle and ‘glassy’ material to a soft, rubbery one. In the context of pressure-sensitive adhesives, the glass transition indicates typically the lowest application temperature of the adhesive.
Towards the right-hand side of the plot, looking at the last modulus crossover point, we can see that G” is above G’ indicating the material is in a fluid dominant viscoelastic state. Above this point, the adhesive is more likely to flow like a liquid and, consequently, have a lower cohesive strength.
The glass transition, Tg, and the last crossover point, Tx, indicate the minimum and maximum limits of the adhesive’s application temperature, respectively.
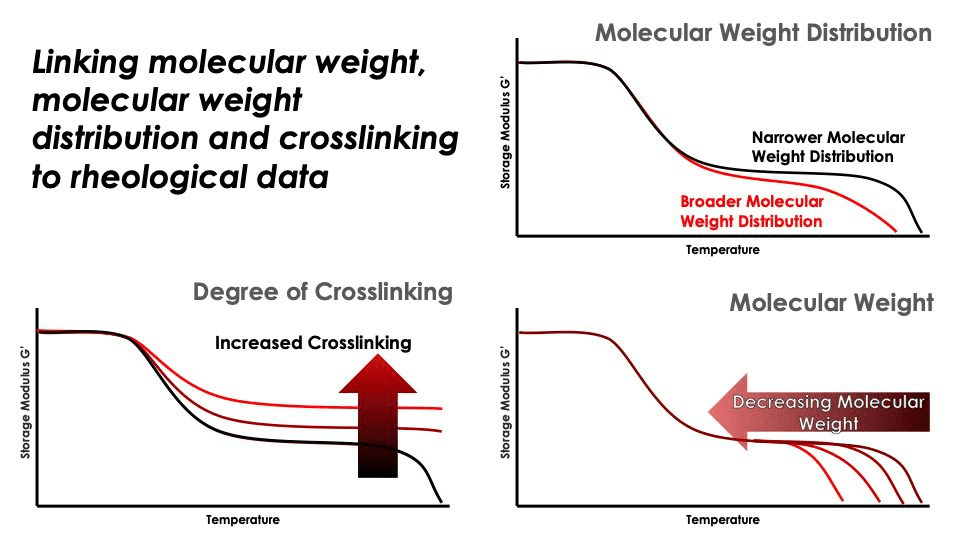
Comparing Molecular Properties – Molecular Weight, Molecular Weight Distribution and Crosslinking
The shape of a dynamic temperature sweep can be used to compare several molecular structural properties. A shorter rubbery plateau region for G* will indicate that the adhesive is likely to have a lower molecular weight than the benchmark.
A steep gradient for the rubbery plateau region suggests a broader molecular weight distribution.
Finally, if the polymer adhesive is crosslinked, the entirety of the curve may be shifted upwards, displaying a higher shear modulus across the range of temperature investigated.
Dynamic Frequency Sweeps and Time-Temperature Superposition
Dynamic frequency sweeps or oscillatory frequency sweeps are helpful in investigating the time-dependent viscoelasticity of adhesives. The moduli values from a frequency sweep will often directly correlate to the performance of the adhesive. Modulus values at high frequency will relate to the peel strength and behaviour of the adhesive. Low-frequency values of G’ and G” will relate to shear resistance. For modulus values that lie somewhere in the middle, this will typically relate to application behaviour.
Time-temperature superposition (TTS) uses frequency sweep data obtained at different temperatures to construct a curve at a single temperature for a broader range of frequencies. This potent technique overcomes instrument limitations of generating frequency data at excessively high frequencies (100Hz+) and time limitations of generating data at excessively low frequencies.
TTS works on the assumption that material behaviours at low temperatures are analogous to high-frequency deformations and material behaviours at high temperatures.
Creep Test – Direct measurement of cold flow behaviour and compliance
Creep tests involve subjecting a sample to a small, instantaneous, and constant stress, tracking change in strain over time. Creep tests are beneficial for quantifying cold flow behaviour and shear compliance (strain divided by stress, or the reciprocal of the shear modulus).
The time-temperature superposition principle can also be applied to a creep test to predict behaviour over a very long period (months or even years). A one-hour test can potentially be used to predict cold flow behaviour that occurs over a period of two weeks!
Axial Tests – tackiness, peel, adhesion, cohesion, and ASTM D2979
Axial tests are common within the industry regardless of the company’s size and are generally direct measurements of the forces required to separate two substrates bonded with an adhesive. Tackiness is generally described as the speed at which an adhesive can form a bond to a substrate – a tackier material will adhere faster than a less tacky one. Peel is a measure of the overall strength of the bond between the substrate and adhesive, with high peel strength adhesives requiring a more significant force to separate than a low peel strength adhesive.
ASTM D2979 is a standard test for measuring the pressure-sensitive tack of adhesives using an inverted probe. A small probe (8mm in diameter) is introduced to an adhesive and pressed into the substrate for a time before being separated at a set speed.
Adhesion can be thought of as the strength of the bond between the adhesive and substrate, whereas cohesion can be thought of as the strength of the bond of the adhesive to itself. Observing the test in action and reviewing the curve can determine whether you have an adhesive or cohesive failure.
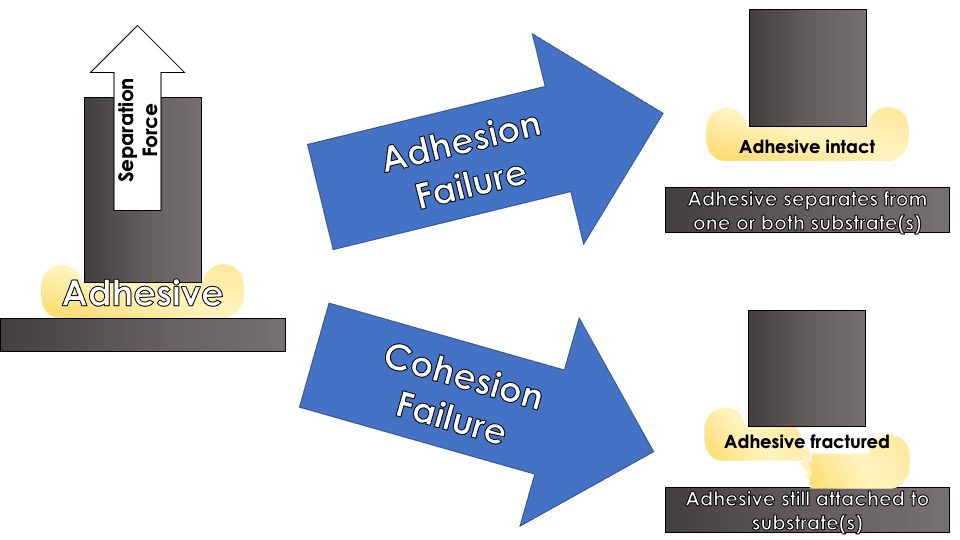
Unfortunately, these tests can be prone to user and environmental errors hampering repeatability and reliability. For similar formulations, it may be not easy to detect differences without vast amounts of testing.
Your partner in the rheological characterisation of adhesives
Whether working with pressure-sensitive adhesives, hot melt adhesives or multiple component adhesives, our lab is familiar with a variety of rheological methods for characterisation and can help you derive the most value from the results. Contact us now to arrange a virtual tour of the laboratory and kick-start the discussion on how we can contribute to improving and optimising the performance of your adhesive products.
Arrange a virtual tour of our lab and discuss adhesive rheology with our experts
Related Articles;
Surface Rheology: Film Formation During Adhesive Curing
Rheological Analysis for Improving Critical Quality Attributes of Grab Adhesives