Rheology and tribology are effective approaches to objectively benchmark and compare dairy milk and plant-based milk based on their physical handling properties and behaviours. The demand for milk alternatives is rising due to concerns over the environment, allergens, nutrition and animal welfare. However, consumer acceptance of these products is a problem due to differences in appearance, mouthfeel and behaviours under storage, when attempting to use these plant alternatives in place of dairy milk.
In this article, we sought to showcase the tribo-rheological differences in a variety of off-the-shelf milk and dairy alternatives. Our fictional customer sought to achieve the following:
- Gain an understanding of the key physical differentiators in the milk and plant-based alternatives market.
- Identify the physical properties of best-selling beverages which might contribute to their success.
- Find potential inspiration for re-formulation strategies.
Interested in a benchmarking study for your beverages? Milk or a dairy alternative?
 In-vitro alternatives to sensory profiling can offer a route for rapid benchmarking and comparison. Viscosity is often the first port of call when comparing beverages on the mouthfeel. However, too often food developers treat viscosity as a single number or their materials as Newtonian in behaviour. A viscosity shear rate sweep describes physical handling behaviours across a range of shear conditions such as those experienced during storage, swallowing or pumping. This shear-thinning viscosity is an essential differentiator for beverages and can help identify some potential differences in mouthfeel perception.
A Stribeck curve can provide interesting information about how this product may be perceived in the mouth in terms of its lubricity/slipperiness. These two techniques in combination can provide a rapid means of identifying key physical differences and similarities in dairy and non-dairy beverages.
Viscosity – Pouring, stirring and swallowing
Milk and its plant-based alternatives tend to be suspensions, emulsions or a combination of both, and as a result, can display complex non-Newtonian behaviour such as shear thinning; the resistance to flow will depend on how you interact with the material. When using viscosity as a comparative tool, it is prudent to measure viscosity under shear rate ranges that are relevant to the process of interest.
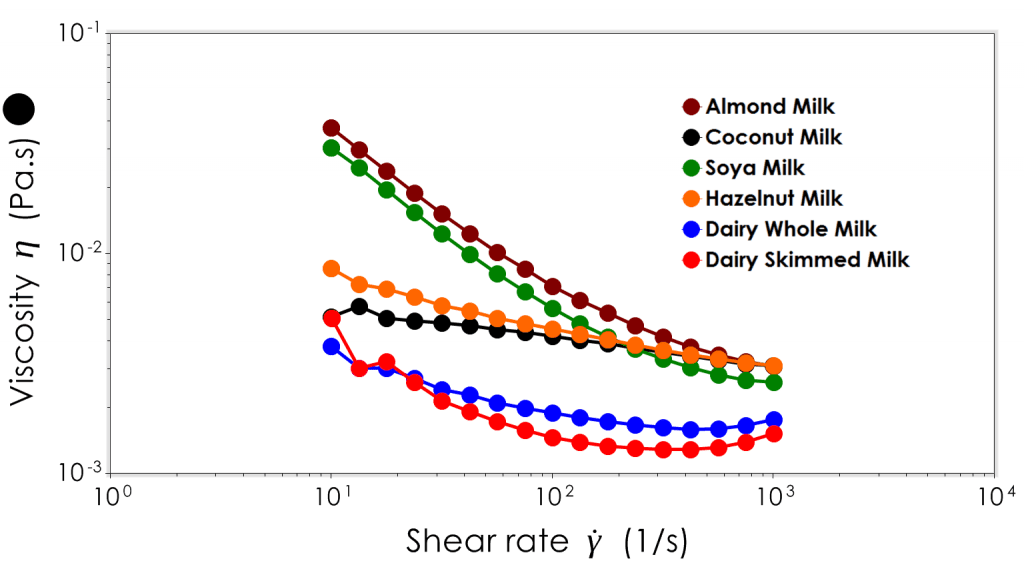
From our testing, we can see the samples are split into three groupings. Almond milk and soy milk initially have a high low shear viscosity but decrease viscosity significantly upon the application of increasing shear. Hazelnut and Coconut milk have much lower low shear viscosities in comparison, and also show less marked shear thinning behaviour. The dairy milks are grouped together and have lower viscosities across the shear rate ranges investigated compared to any of the plant based milks.
Tribology – Lubricity and late stage mouthfeel
Tribology seeks to measure the contribution of a liquid to reduce friction between two interacting surfaces. In this instance we used a custom built soft-tribology attachment mimicking the tongue rubbing against the palate. In an ideal situation it should be possible to identify three portions of the curve, relating to distinct lubrication regimes.
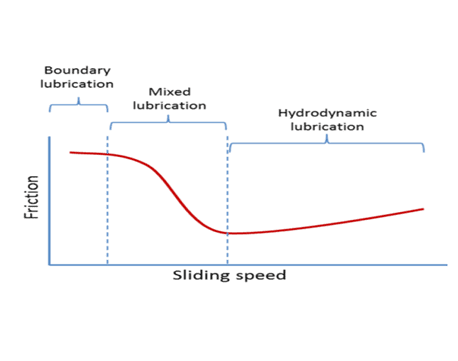
In a boundary lubrication regime, there is a high degree of contact between the two surfaces and typically can be seen as a region of a high friction coefficient at a low sliding speed. During the mixed lubrication regime, as sliding speed is increased, surface contact between the two surfaces is reduced as liquid is entrained into asperities on the surfaces. This process of entrainment continues until the onset of hydrodynamic lubrication where complete separation of the two surfaces occurs.
The application of tribology to foods is still a relatively new and developing field, still not having direct comparisons of specific processes to sliding speed ranges or definitive limits for the onset of a specific lubrication regime . However, as we can see from the plot below, this technique provides us with new and significantly differentiating information. To gain value from these analyses we treat these profiles as ‘fingerprints’ describing in general the lubricating behaviour of the sample.
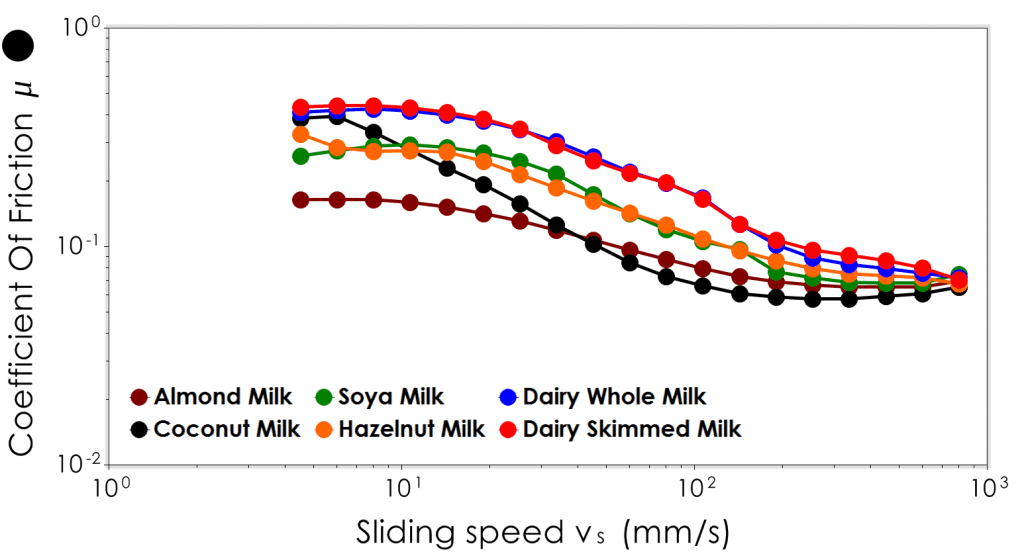
The tribology profile groups the products slightly differently – the dairy milks are still grouped together, and have the highest coefficient of friction across the sliding speeds measured.Hazelnut and soy milk have comparable Stribeck curves, and have a lower coefficient of friction across all sliding speeds when compared with the dairy milks.
Coconut milk has a high coefficient of friction at slow sliding speeds, that reduces rapidly with increasing sliding speed. At higher sliding speeds, coconut milk has the lowest coefficient of friction of all samples tested. Almond milk starts with a very low coefficient of friction at slow sliding speeds, covers the smallest range of coefficient of friction measurements compared to all the other samples and is second only to coconut milk in terms of its lubricity at higher sliding speeds.
Simple Visual Benchmarking – Protein, Fat Replacement or Other Changes
There are a number of potential contributors to these differences; droplet and/or particle size distribution, the use of rheology modifiers – emulsifiers, texturants, differences in solid content, fat/oil content, proteins, carbohydrates, etc. Coupling these variables with statistical analyses and machine learning techniques presents some interesting insights, different factors for modification or presentation of high value targets to achieve a specific texture.
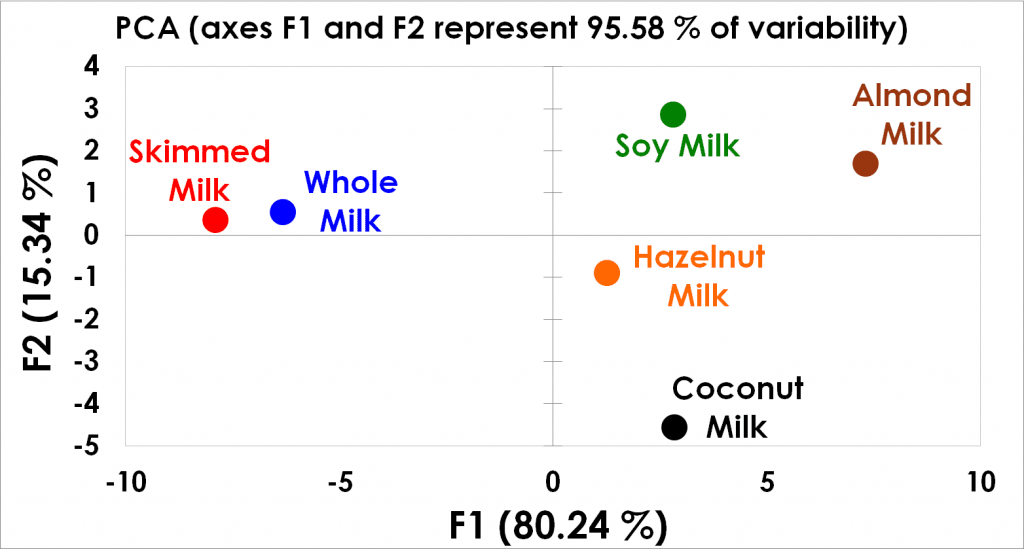
It is no surprise skimmed milk and whole milk appear close together in the principle components analysis plot being of highly similar composition. The plant based beverages are grouped further away and cover a wider area. All of the plant based milks make use of gums and stabilisers which is likely contributing to their distance to skimmed milk and whole milk.
These analyses present the texture of the samples in their pure form, however during oral processing, mucins, enzymes and other components present in saliva can significantly affect the perceived texture of these beverages. Astringency has been purported to be a result of mucin and polyphenols interacting to increase viscosity and reduce lubrication. For more information about approaches to consider components of saliva, please check out our page on mucoadhesion testing. Or if you would like to discuss the feasibility of running a project similar to the one outlined here, please feel welcome to contact us.