 Foaming is an important property of many household cleansers. By analysing the foaming behaviour of these products, the longevity and stability of their foams can be characterised, which can be useful when benchmarking new formulations against current ones or formulating for a specific need. This study compares the foaming behaviour of two surface cleansers using dynamic foam analysis, and also showcases how foaming behaviour differs between two methods of foam generation.
Contact us to arrange a lab tour and discuss comparing astringency techniques with our experts
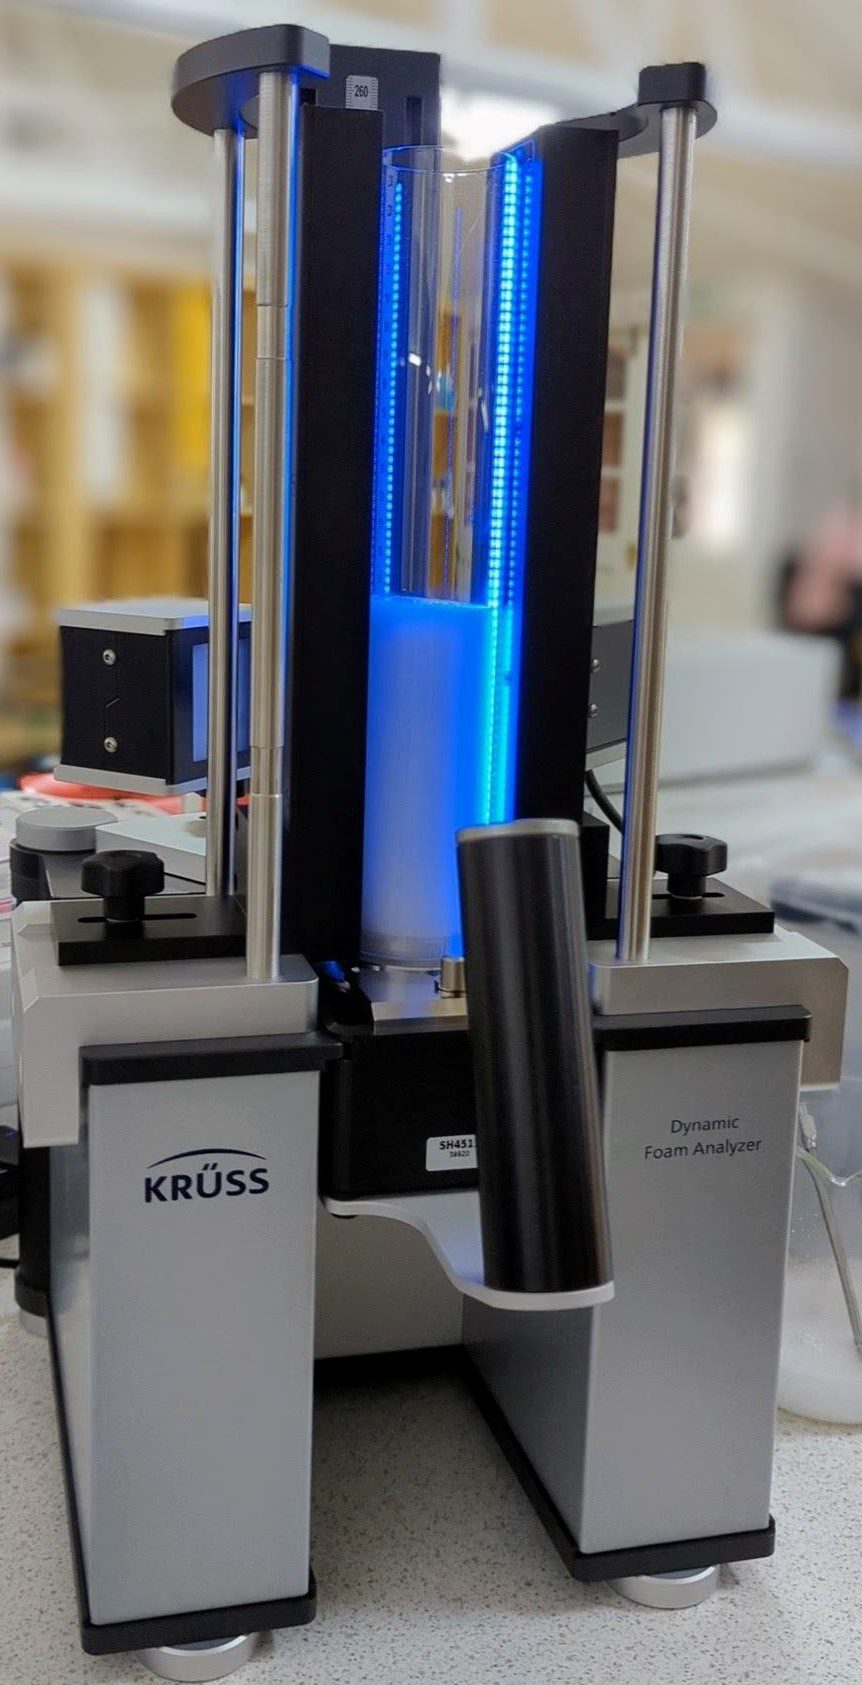
Dynamic Foam Analysis
Dynamic foam analysis can provide useful insights into the foaming behaviour of liquids. From simply measuring the height of the liquid and foam fractions of a substance, important metrics, for example foamability (how well a substance foams) and foam stability (resistance to drainage), can be gleaned. When paired with a structure module, real-time imaging of the bubbles can be recorded, allowing for the rate of increase in bubble size and homogeneity of bubble size distribution to be calculated. Foams that resist increase in bubble size are said to be more stable than those that increase rapidly. Knowing the foamability and foam stability of a formulation can be invaluable and inform whether foam formation is a requirement or a hindrance to its application.

Use of foams as cleansers
Consumers tend to associate foam with cleaning performance. For example, a common assumption when washing up is if bubbles or foam are still present in the wash bowl, the utensils are being cleaned effectively. Whilst this is not necessarily the case, it helps to explain why foaming for consumer products, especially those used for cleaning, is a key characteristic.
For cleaning products such as surface cleansers, foam goes further than just being an indicator of efficaciousness. Foam allows formulations to cling to surfaces and draw oils and fats from the surface via capillary action, making for effectual cleaning. To this end, antibacterial sprays for use in the kitchen are often paired with degreasing agents and surfactants with a greater propensity to foam for easy surface cleaning.
Foams can be generated by several different approaches. Common methods include sparging, agitation/stirring, and shaking, all of which produce different types of foam. Parameters such as gas intake, turbulence and velocity of the process have influence over the foam stability and structure.
The propensity of a product to generate foam can also be called its foamability. A product with poor foamability would produce less foam (smaller height) under the same conditions as one with good foamability. Once a foam has been generated, its stability can be quantified by measuring its drainage. Drainage is also linked to foam height as the liquid fraction will increase in height whilst the foam fraction will decrease. Very unstable foams will also collapse from the top down as bubbles burst.

Methodology
For this investigation, two different formulations from a leading brand were compared:
- Sample A – regular antibacterial surface cleanser
- Sample B – antibacterial surface cleanser with “active oxygen”
Neat sample (50 mL) was either sparged with air for 30 s at 0.3 L min-1 through 12–25 μm pore filter paper, or stirred for 30 s at 3000 rpm with a flat paddle stirrer head.
Foam height analysis
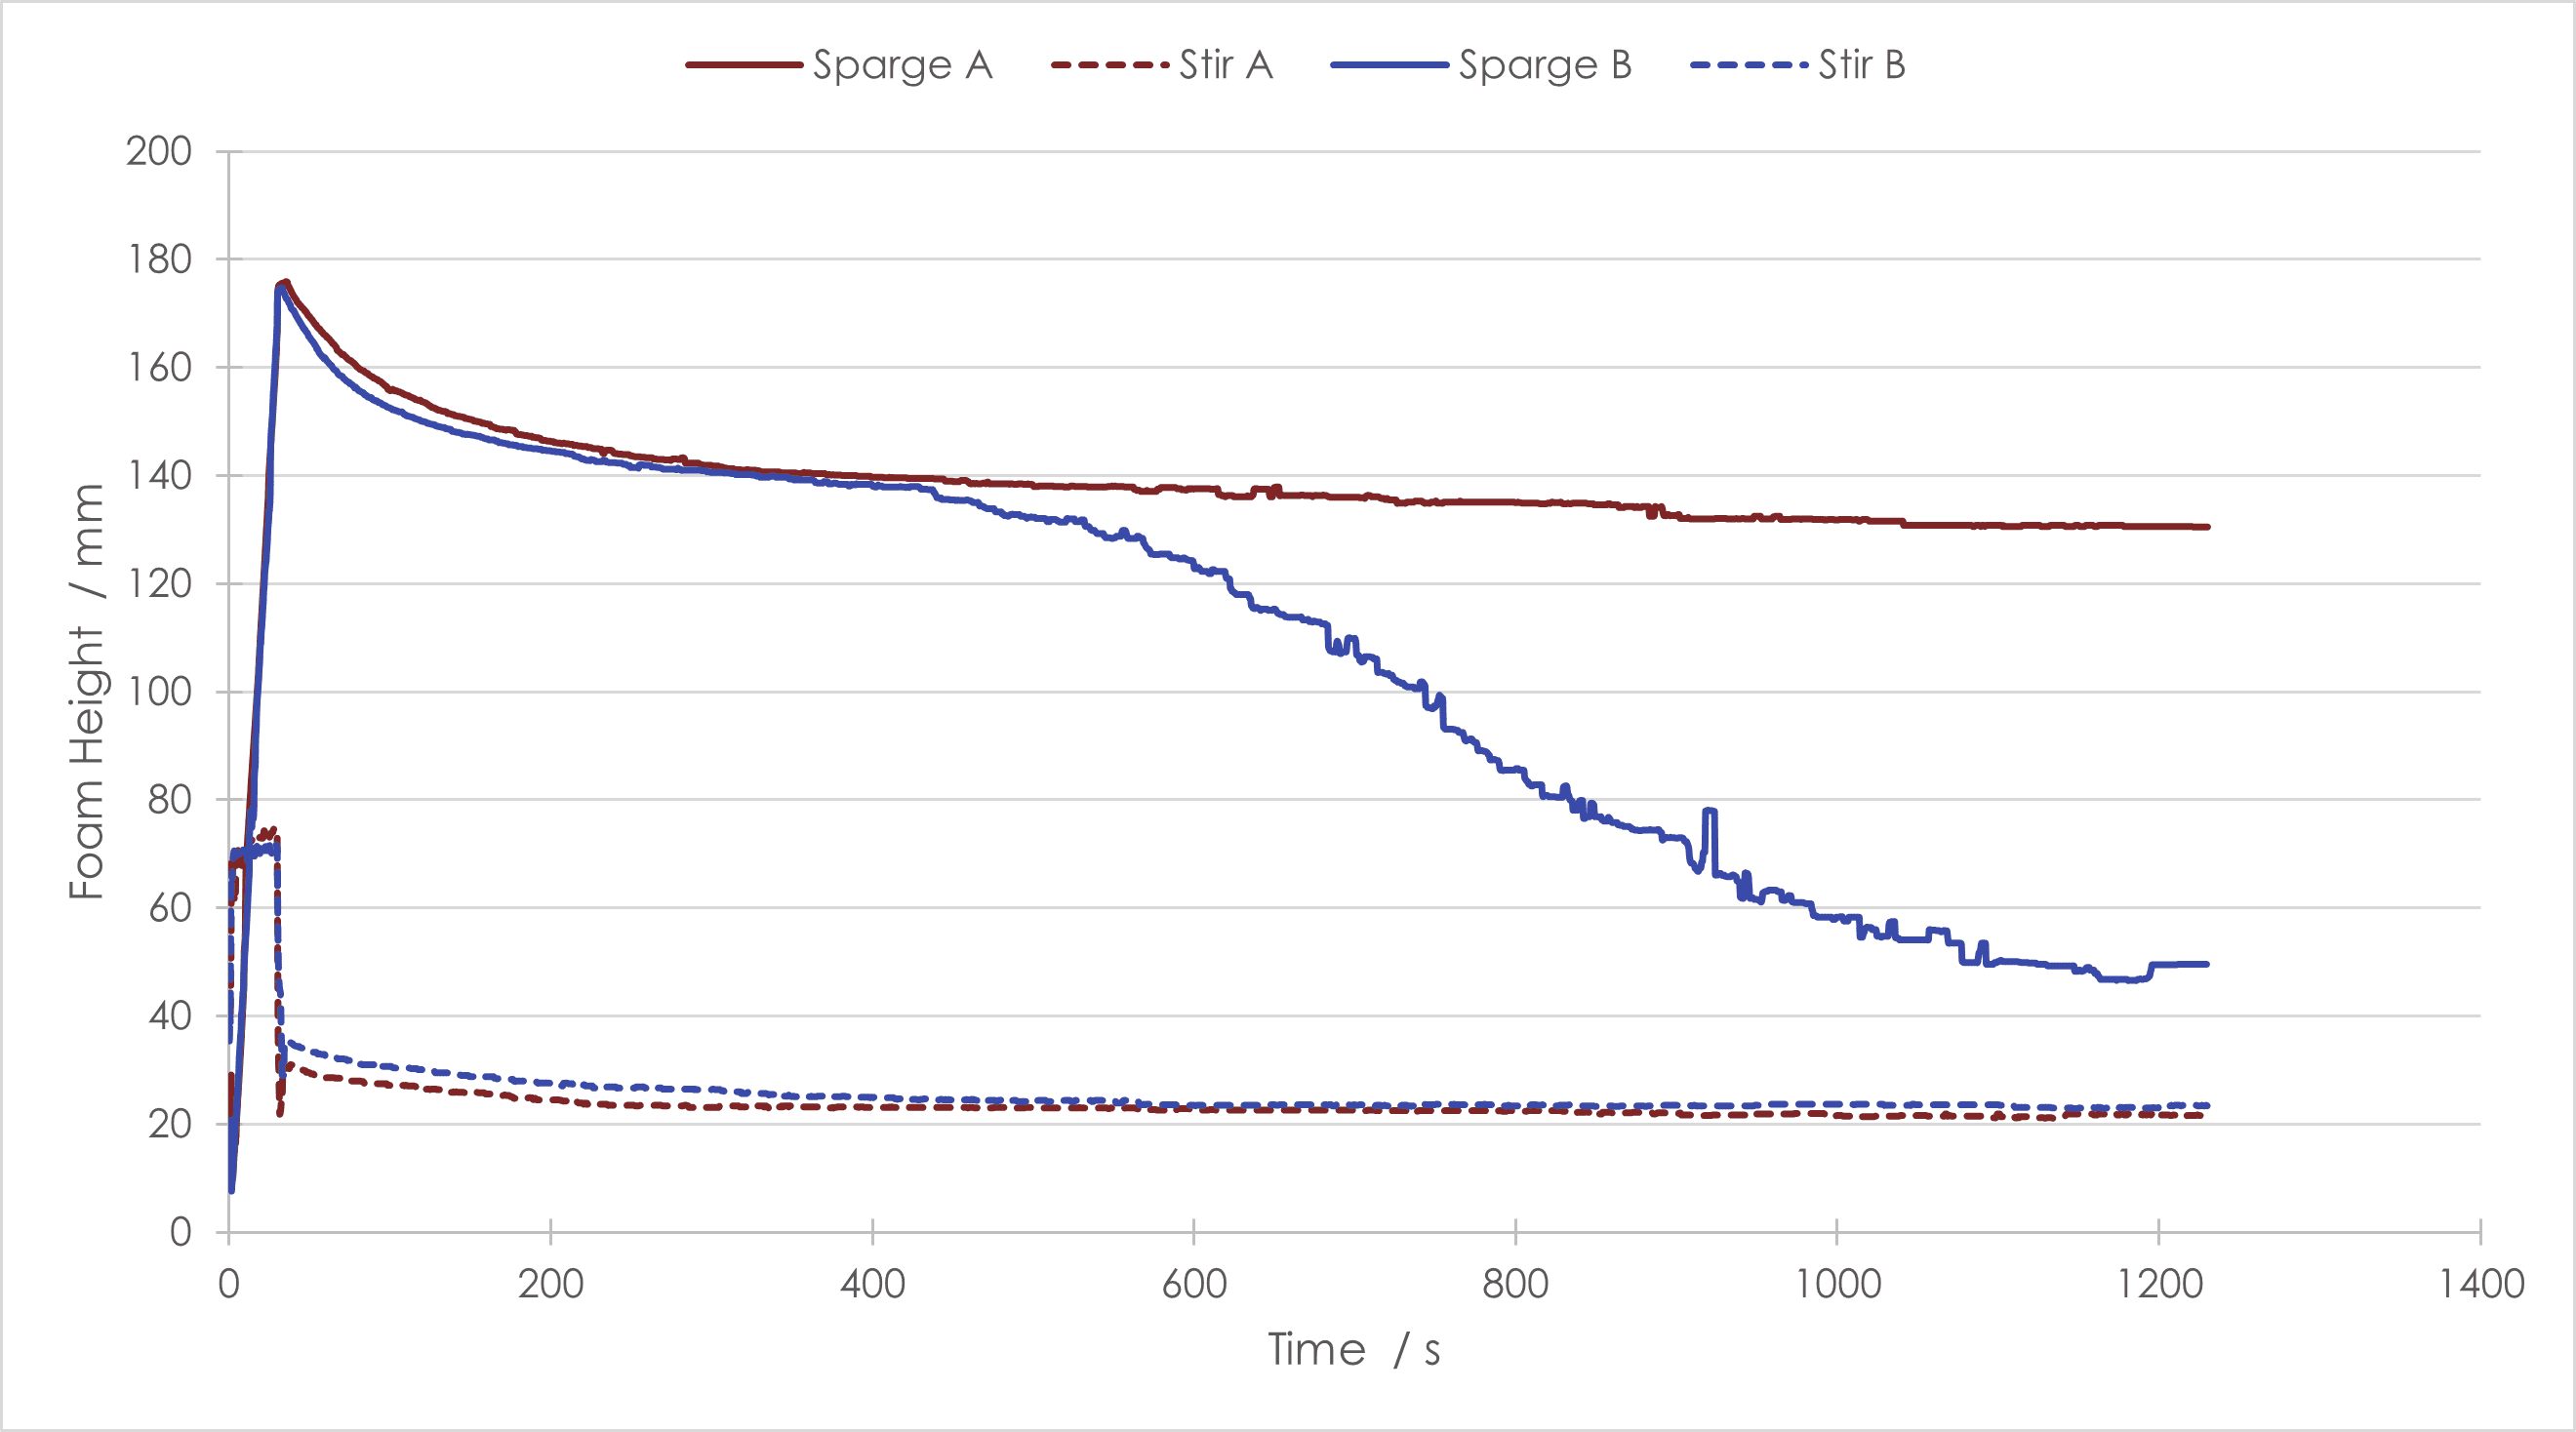
Using sparging and stirring generation methods, both samples produced appreciable foam. They both had a vastly greater foamability when sparged that contrasted significantly with foam generation by stirring.
When comparing only the foams produced via stirring, there was little difference between Sample A and B. Once reaching a plateau after ~400 s, the foam heights of both samples changed very little, Figure 1. When sparging was used to generate the foam, there were stark differences between the samples. Both samples decreased in height exponentially immediately after sparging ended, but whilst the foam height from Sample A reached a plateau of sorts, the foam height from Sample B continued to decrease rapidly. This clearly shows that the method of foam generation has a drastic influence on foamability and foam stability, and the formulations used for the surface cleansers are very different in relation to foam behaviour.
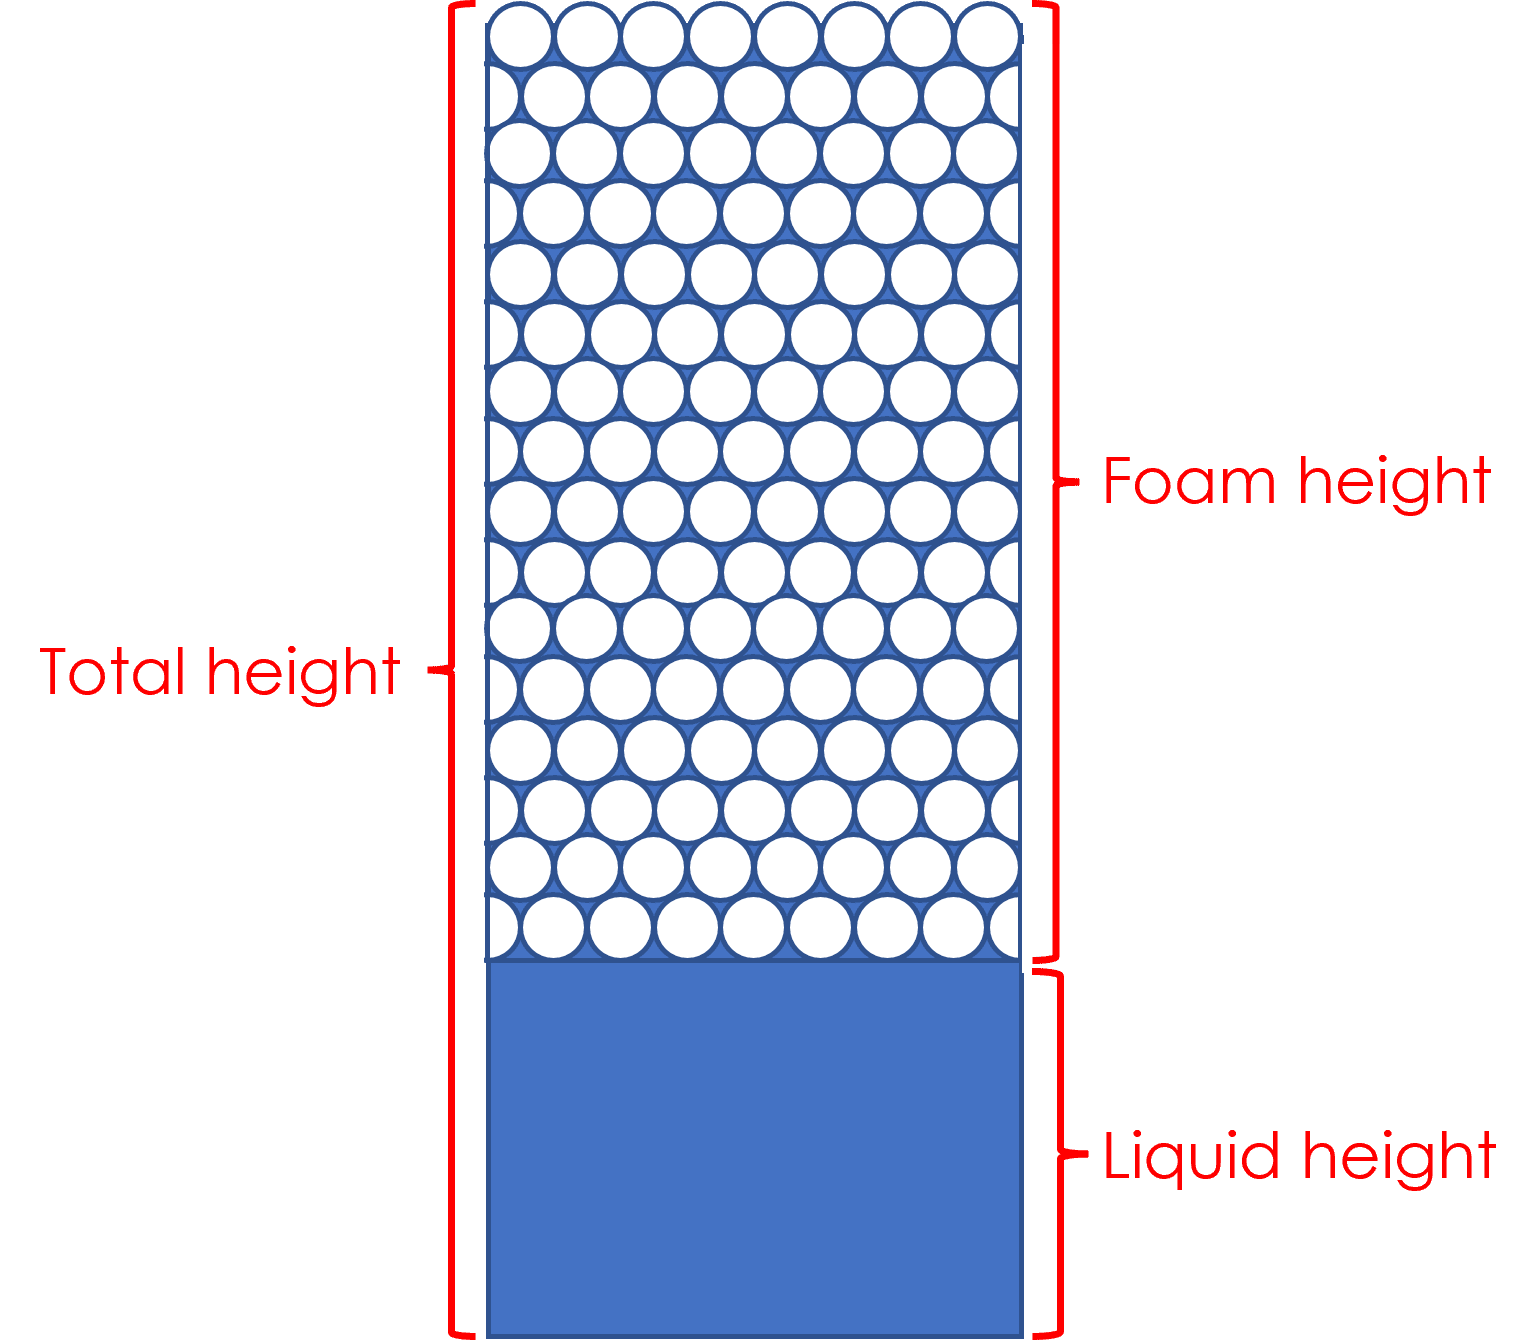
It should be noted that the mechanisms of degradation differ with time and from sample to sample. Foam decay due to drainage can be seen when the total height remains constant, but foam height decreases. This is due to the liquid fraction (Figure 2, liquid height) increasing as the liquid drains from the foam. Foam decay from top-down collapse is evidenced when there is a concurrent decrease in both total height and foam height.
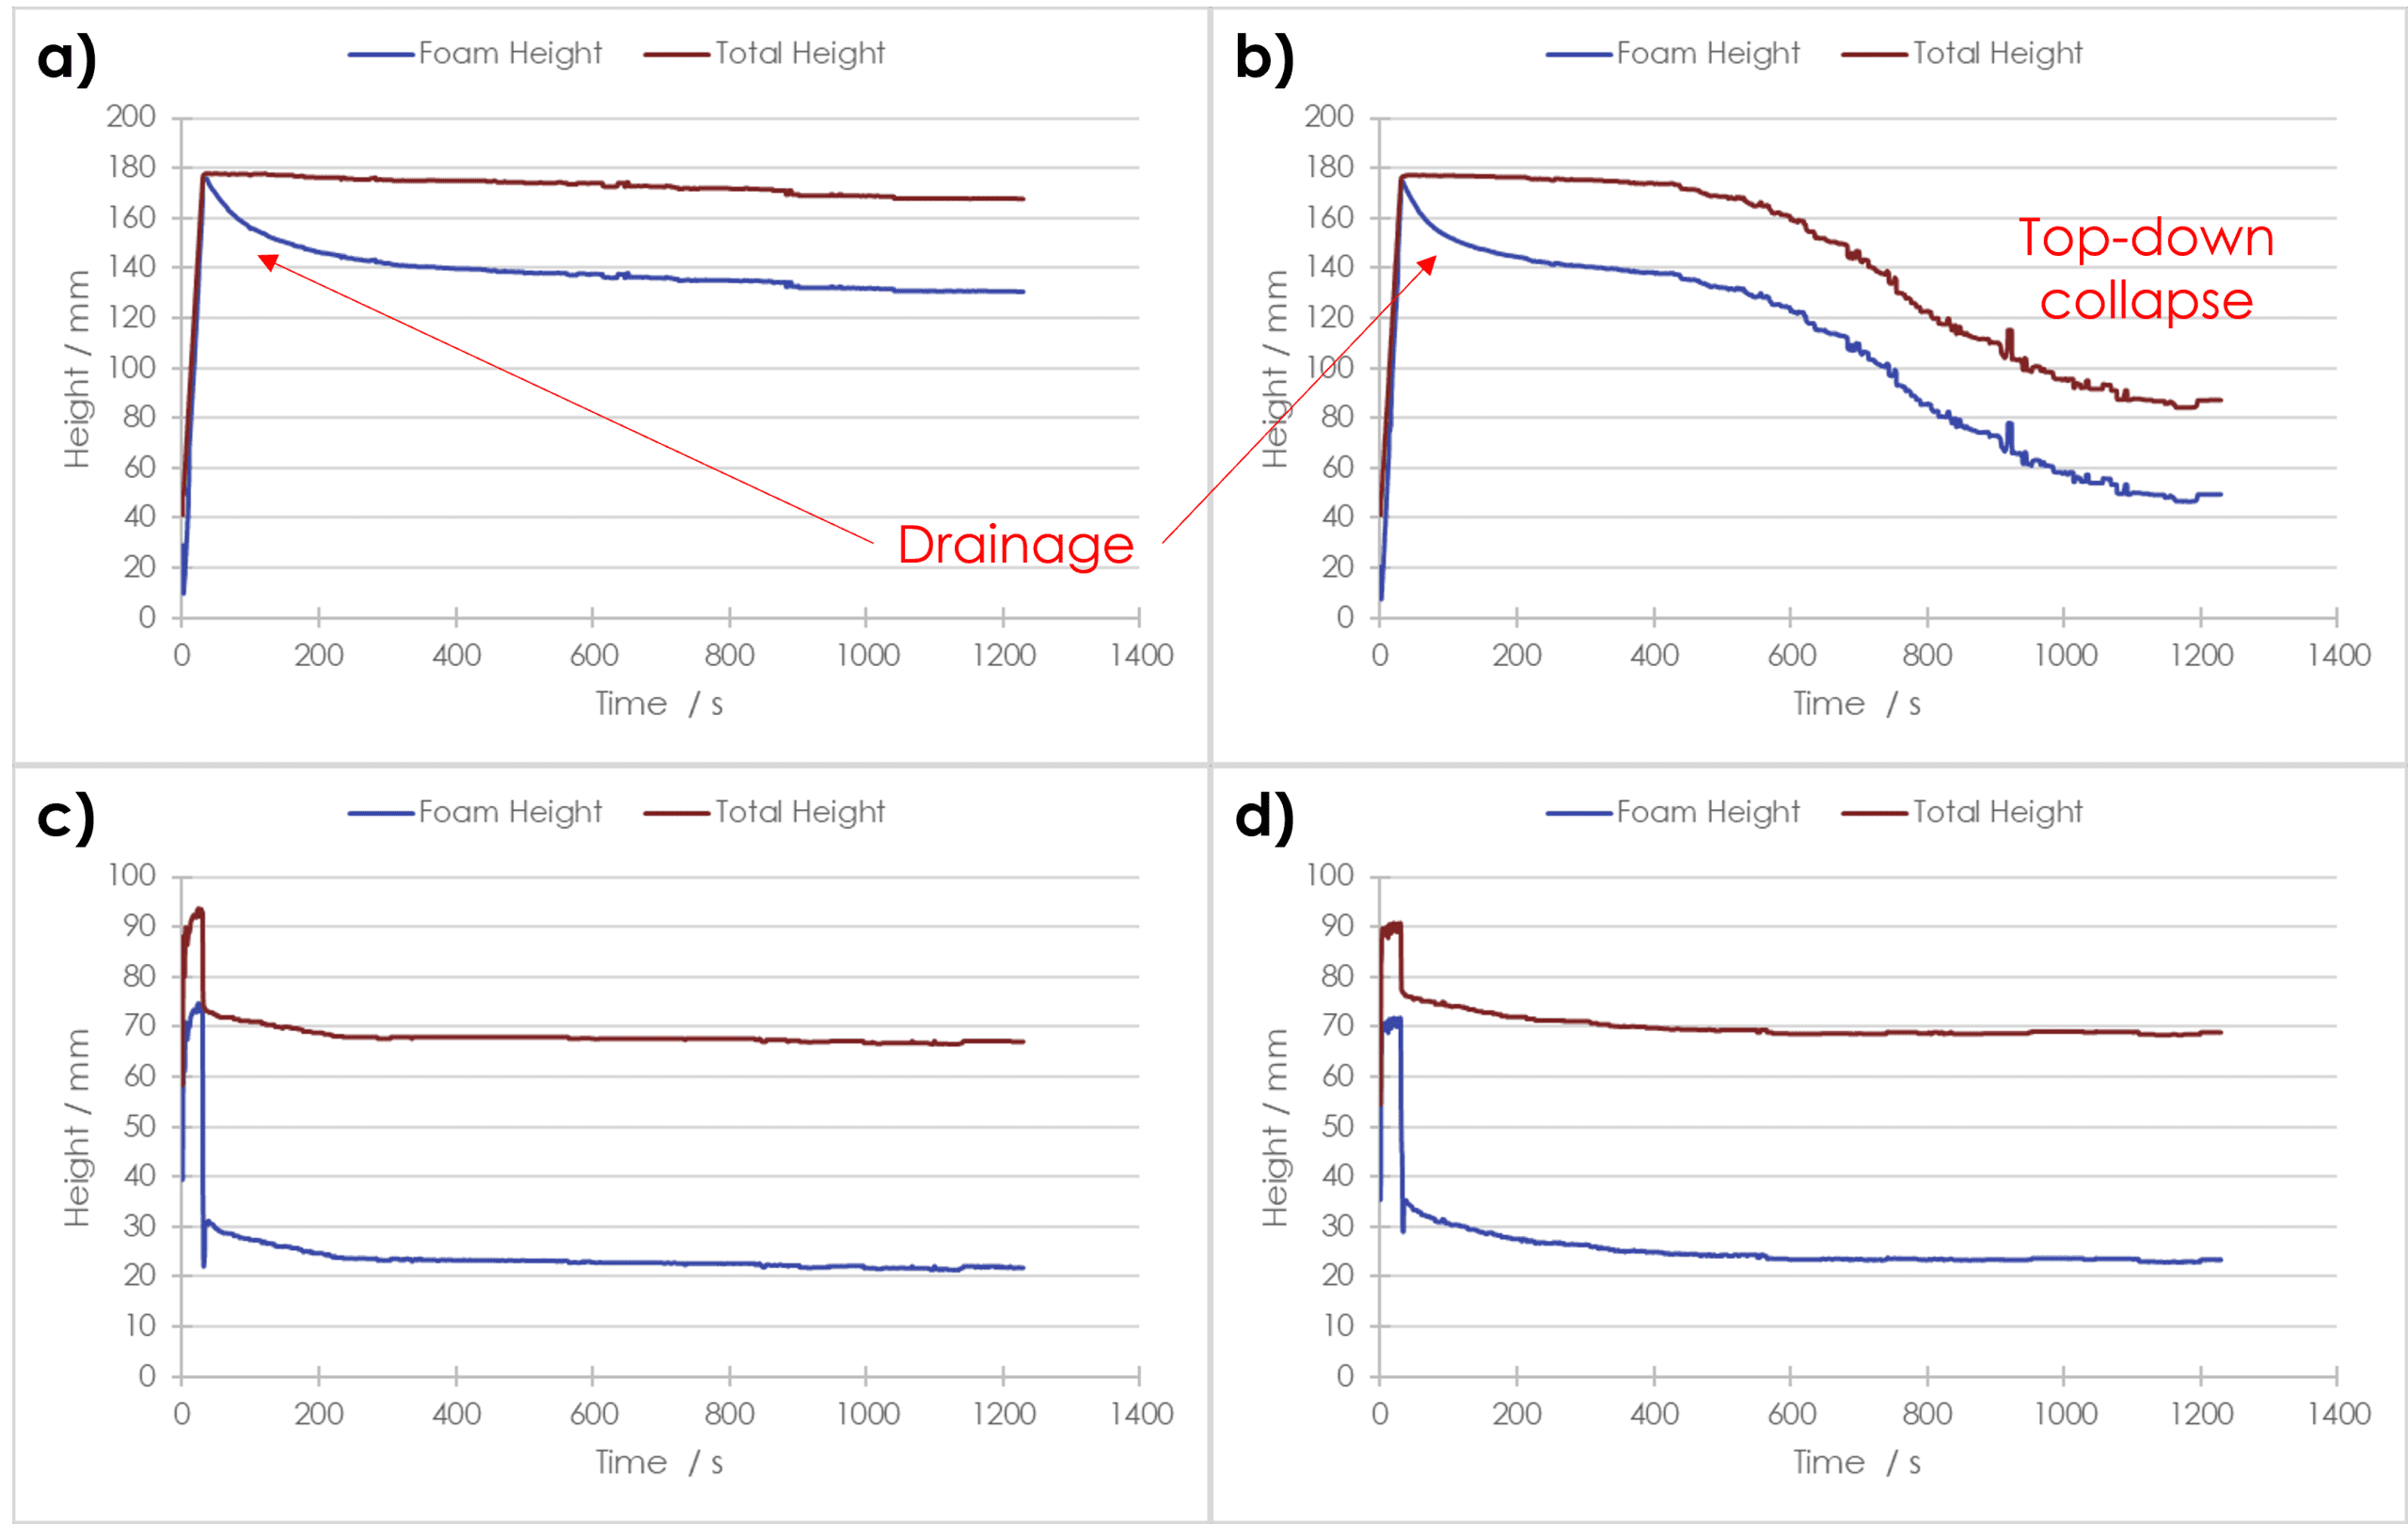
To that end, Figure 3a shows that the sparged foam from Sample A underwent initial decay from drainage only, then after ~200 s endured slow top-down collapse with minimal drainage. Up to ~200 s, sparged foam from Sample B (Figure 3b) followed the same drainage decay as Sample A, but then suffered dramatic top-down collapse. Stirred foam from both samples (Figure 3c/d) underwent slow initial top-down collapse but plateaued after ~300 s and ~400 s for samples A and B, respectively.
It can be gleaned from these plots that when generated by stirring, foams from samples A and B had similar stability to drainage and top-down collapse. However, when produced by sparging, the foam from Sample A was much more resistant to top-down collapse but had roughly the same resistance to drainage as the foam from Sample B.
Bubble structure analysis
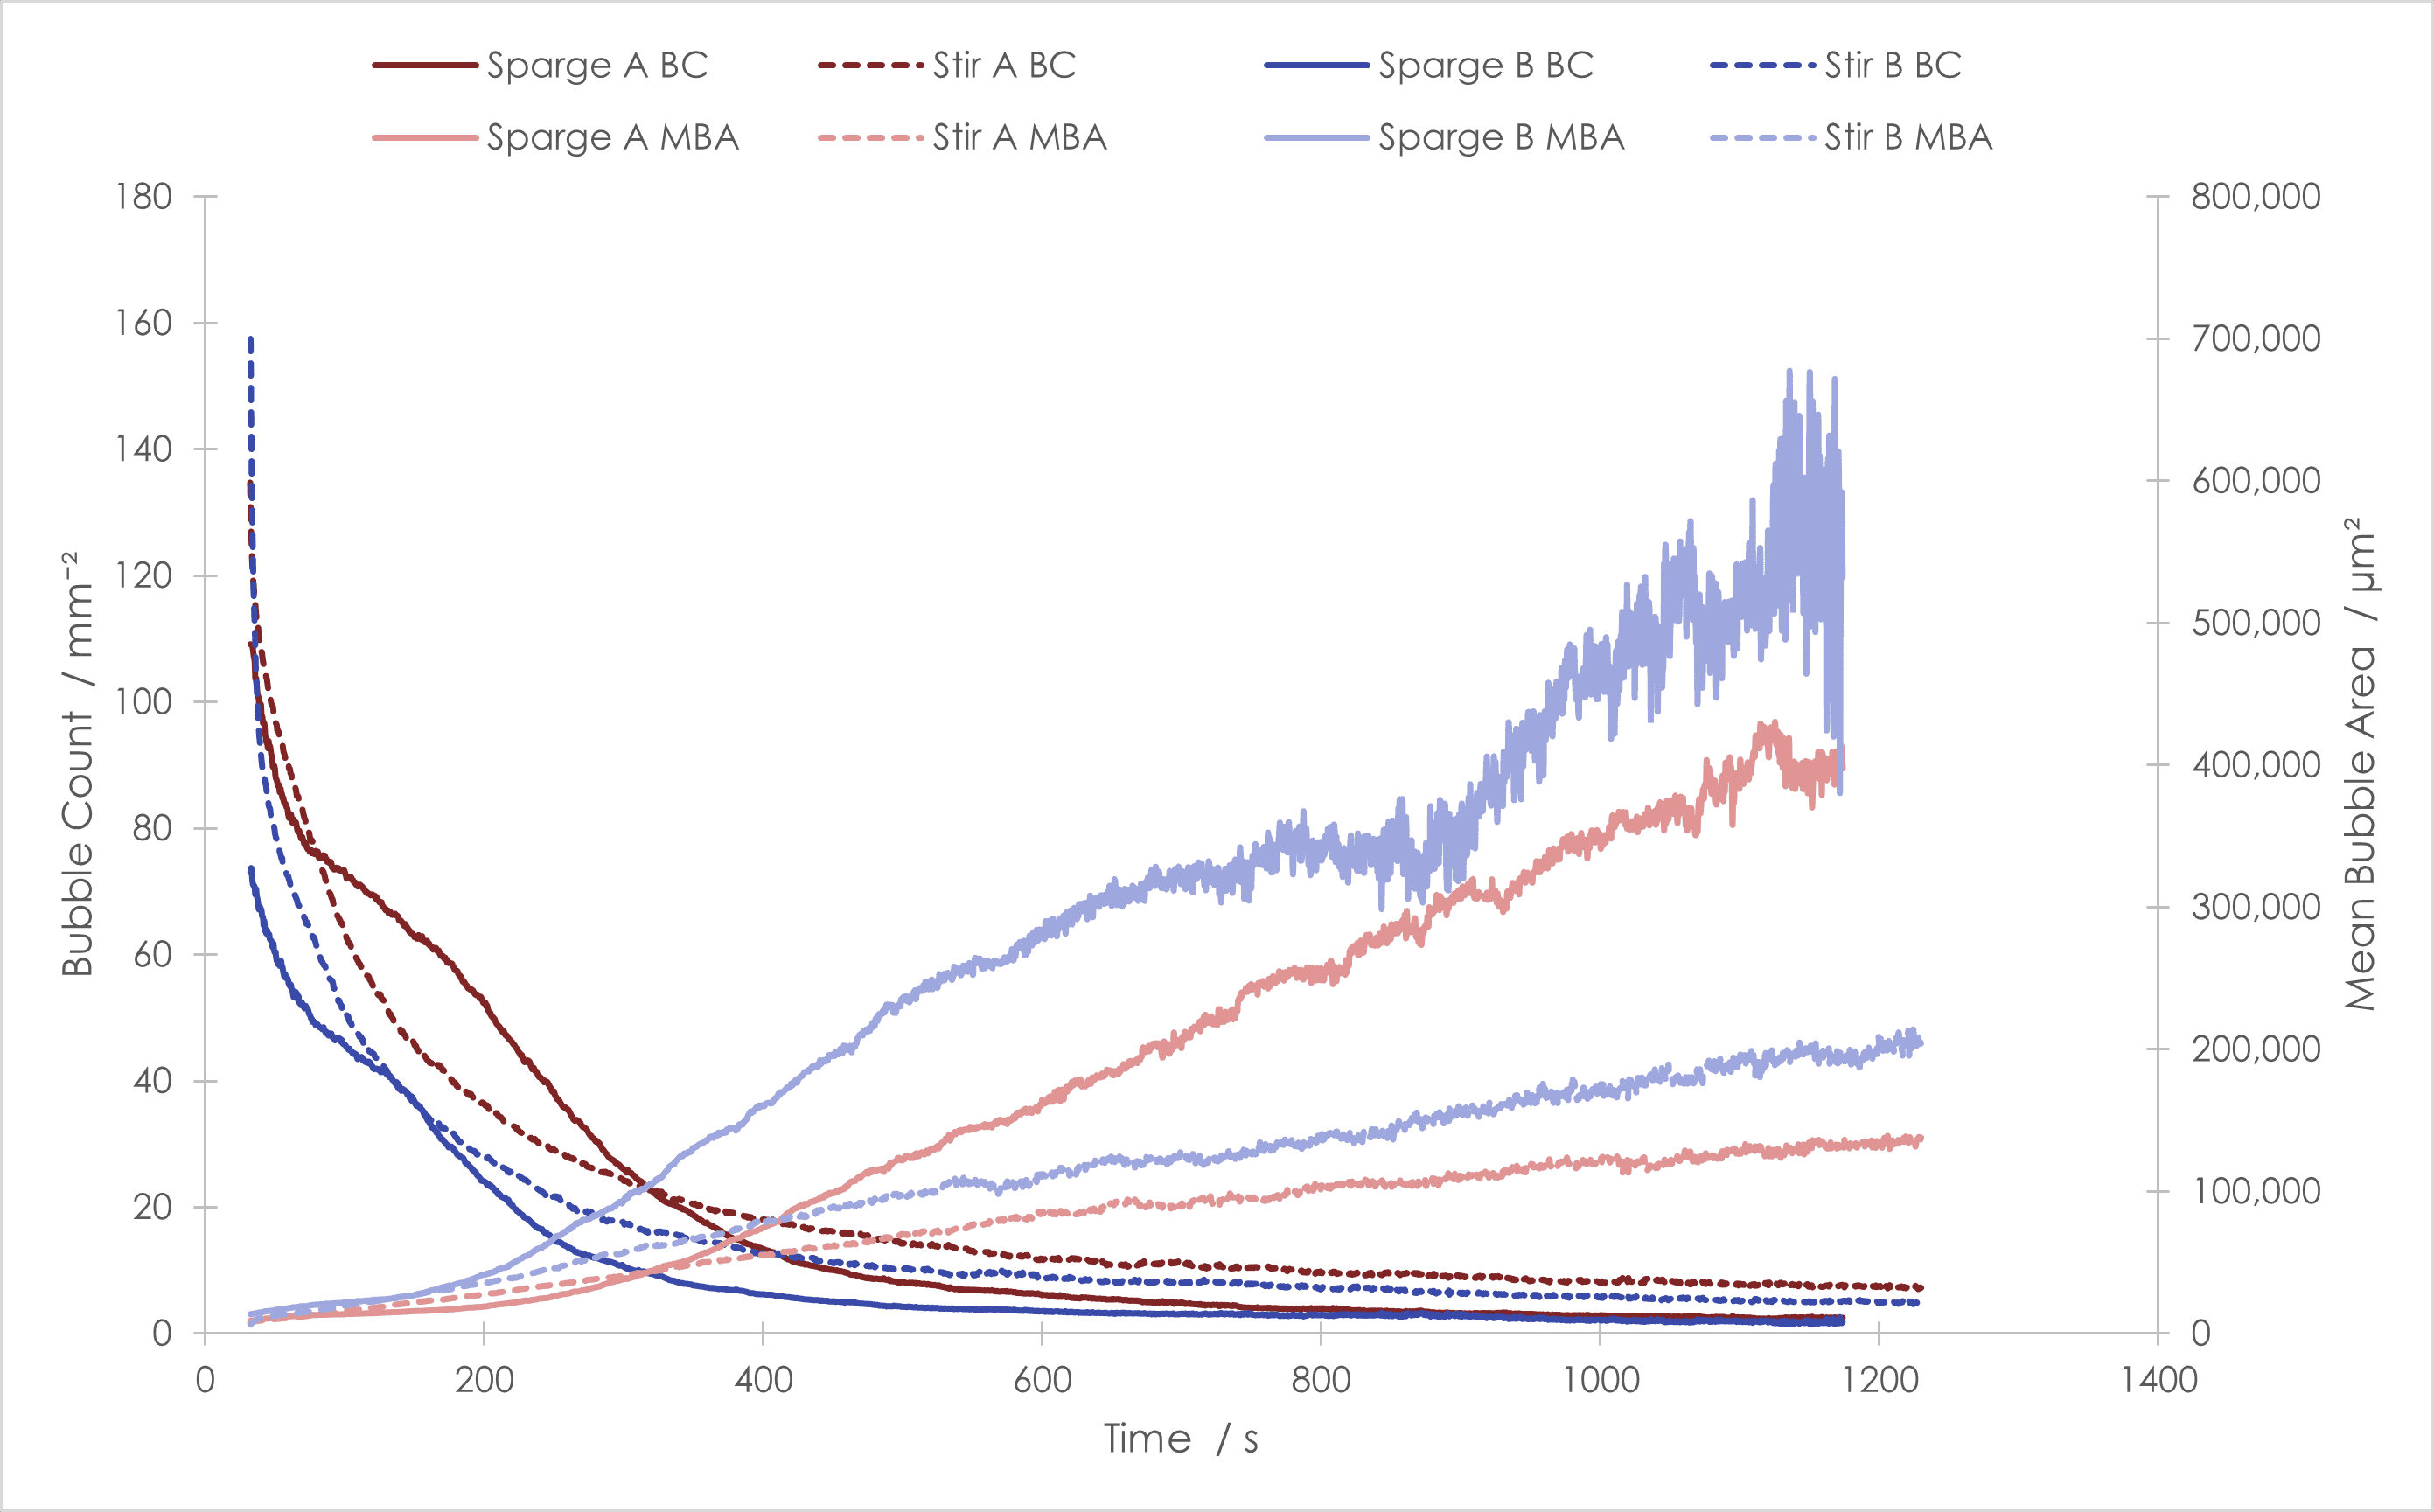
Another method of monitoring foam stability is by measuring the size of the bubbles over time. Bubbles of a less stable foam will increase in size at a greater rate than those of a more stable foam. In this study, clear differences were seen in the structure of the foams, both between samples and between generation methods. The sparged foams initially had fewer bubbles per unit area than those produced by stirring, Figure 4. The sparged foams also had uneven rates of decrease in the bubble counts, whereas the stirred foams had a smooth exponential decrease. Sample A foams always had more bubbles per unit area than Sample B foams for each generation method, although by the end of the measurements these differences were negligible.
Comparing the mean bubble areas of the foams, all four initially had similar values but evolved differently with time, Figure 4. By stirring the samples, the foams generated had smaller mean bubble areas in general over the period of measurement. Sample A produced foams with a smaller mean bubble area from both generation methods, and had a lower rate of increase than those of Sample B. The sparged foams from Sample A had a lower mean bubble area and rate of increase than its stirred counterpart until ~300 s, when the rate of increase of mean bubble area became greater.
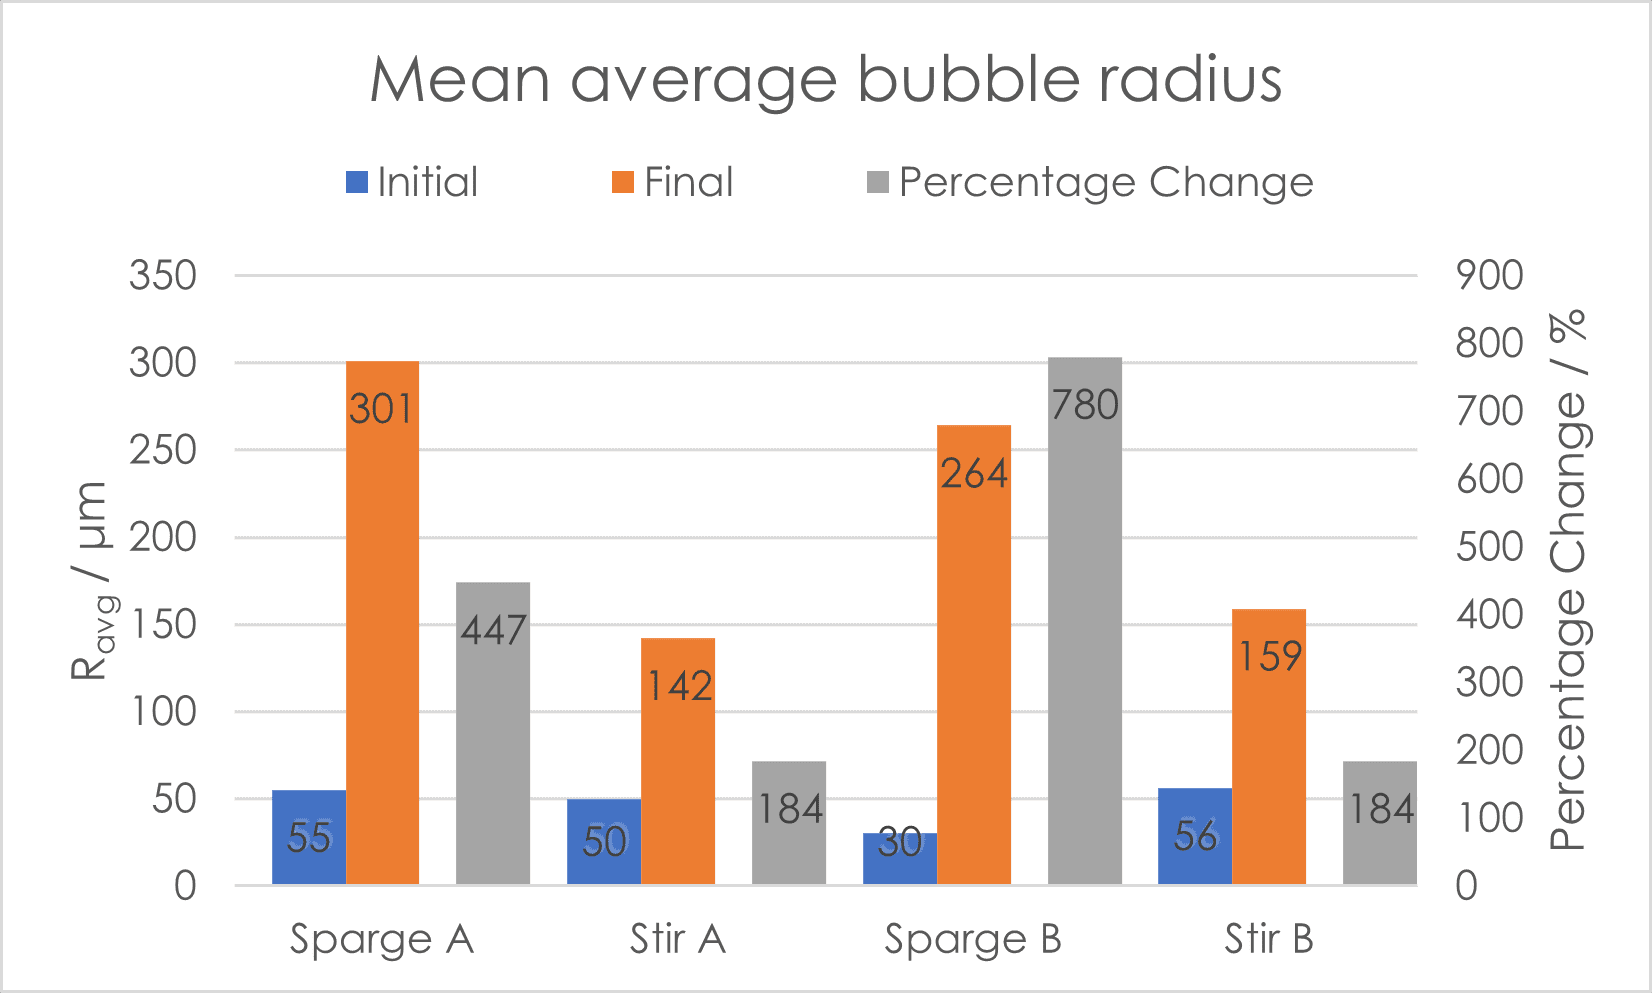
It is clear from these data that stirring the samples produced much more stable foams in terms of structure, meaning they are much more resistant to structural changes from coalescence and Ostwald ripening. Figure 5 shows this quantitatively.
Conclusion

In summary, we performed foam analysis on two surface cleanser samples and compared them using two foam generation methods. Stirring produced foams more stable to drainage and top-down collapse and bubble agglomeration/ripening for both samples. Sparging produced less stable foams from both samples, and differences in foam collapse were seen. This study was useful in proving how different foam generation methods can vastly affect foam stability and structure.
Comparative studies like this can be useful in benchmarking samples against effective/current formulations or competitor products. Get in contact with us to find out how we can help.
For further information about these tests, or the range of tests that we offer, please contact our experts today