Using dynamic surface rheology, we have been able to rheologically characterise formation of a film as an adhesive cures. This has provided valuable insight into filming behaviour over a range of temperatures, and also highlighted how sample preparation and treatment during data collection can impact upon data collected and subsequent interpretation.
Contact us to arrange a lab tour and discuss surface rheology with our experts
Drying vs curing
As glues and paints dry or cure a film is formed on the surface. Drying is where a volatile component is lost from the paint or adhesive, resulting in a solid film. During drying, the adhesive or paint is not chemically altered, and the dried product can still be dissolved in the original solvent. In contrast to this, curing is where a chemical reaction occurs and the chemical composition of the adhesive or paint changes. This results in a physical change from liquid to solid and is irreversible.
Film formation and MFFT
The rate at which a film forms on the surface of a bulk material can be quantified using rheology, a valuable tool for comparing product drying or curing behaviour. Using a technique specifically designed to interrogate film formation, we can compare the curing or drying performance of film-forming materials. Comparison of drying/curing performance over a range of temperatures, investigating the point at which a film is formed, and quantifying the film’s strength are now all possible and readily accessible. This tool is particularly applicable to the paints industry and is a complementary technique to minimum film-forming temperature (MFFT), a commonly-used metric to investigate a paint’s performance.
Case study: Curing adhesives
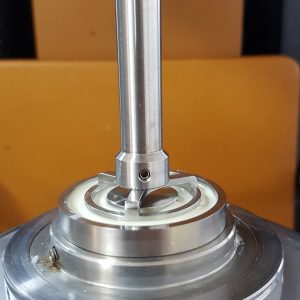
To showcase some of the capabilities of dynamic surface rheometry, we studied the curing behaviour of a well-known latex-based adhesive. Initial experiments sought to ascertain if there were differences between the curing rate at different temperatures: 20 °C, 30 °C and 40 °C. This was achieved by monitoring the formation of film on the surface of the adhesive. The samples were uncovered during data collection.
Comparing rates of film formation
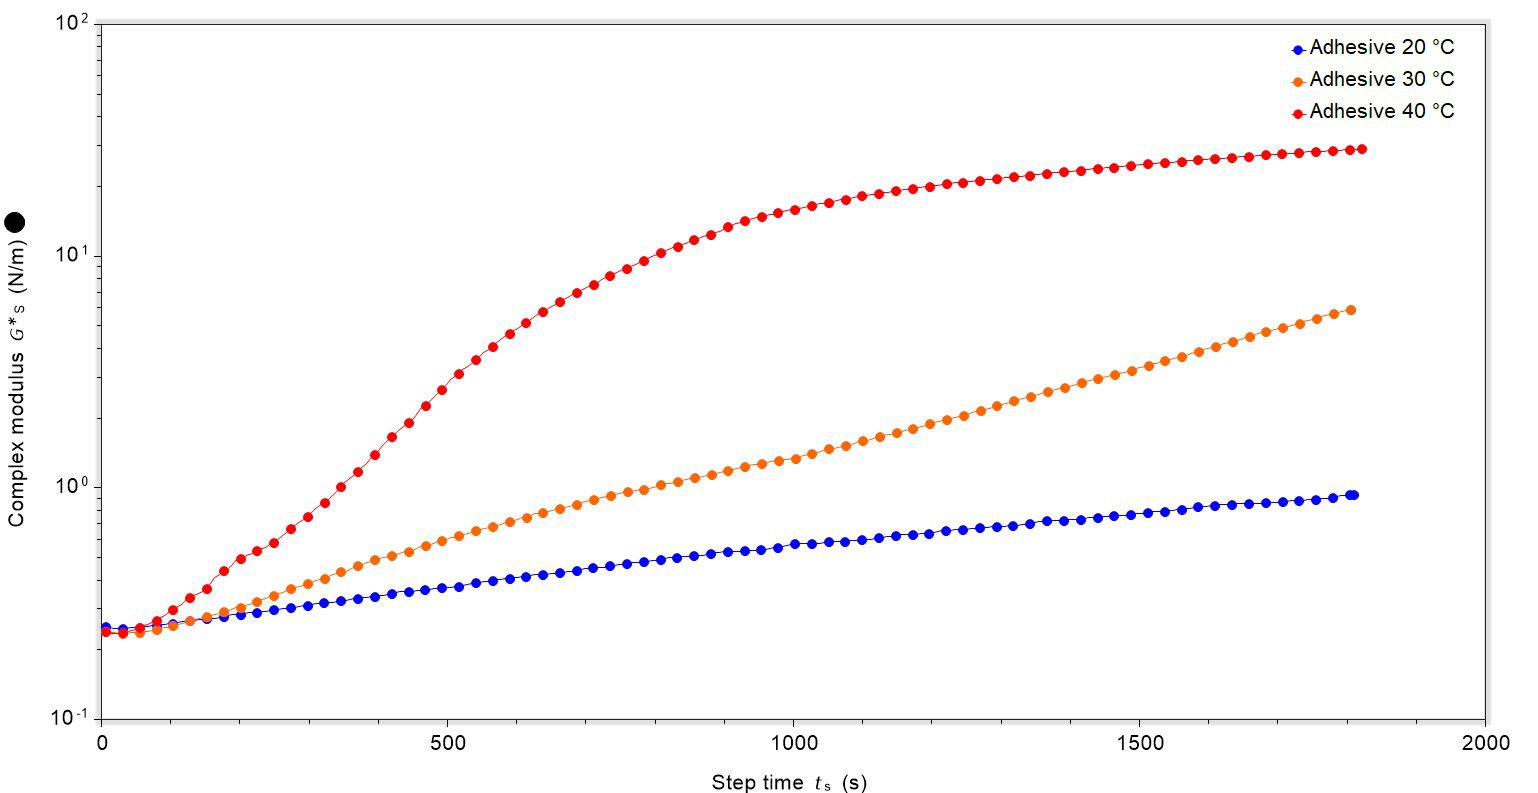
There was a clear correlation between temperature and rate of cure, with film formation fastest for the adhesive at 40 °C and film formation slower for samples at 30 °C and 20 °C, Figure 1. It can be clearly seen that once the complex modulus reaches a threshold point there is no further significant increase, and the film’s maximum rigidity is reached (showcased by the complex modulus of the film at 40 °C). An extended 4800 second experiment for the sample at 40 °C clearly showed this to be the case (data not shown).
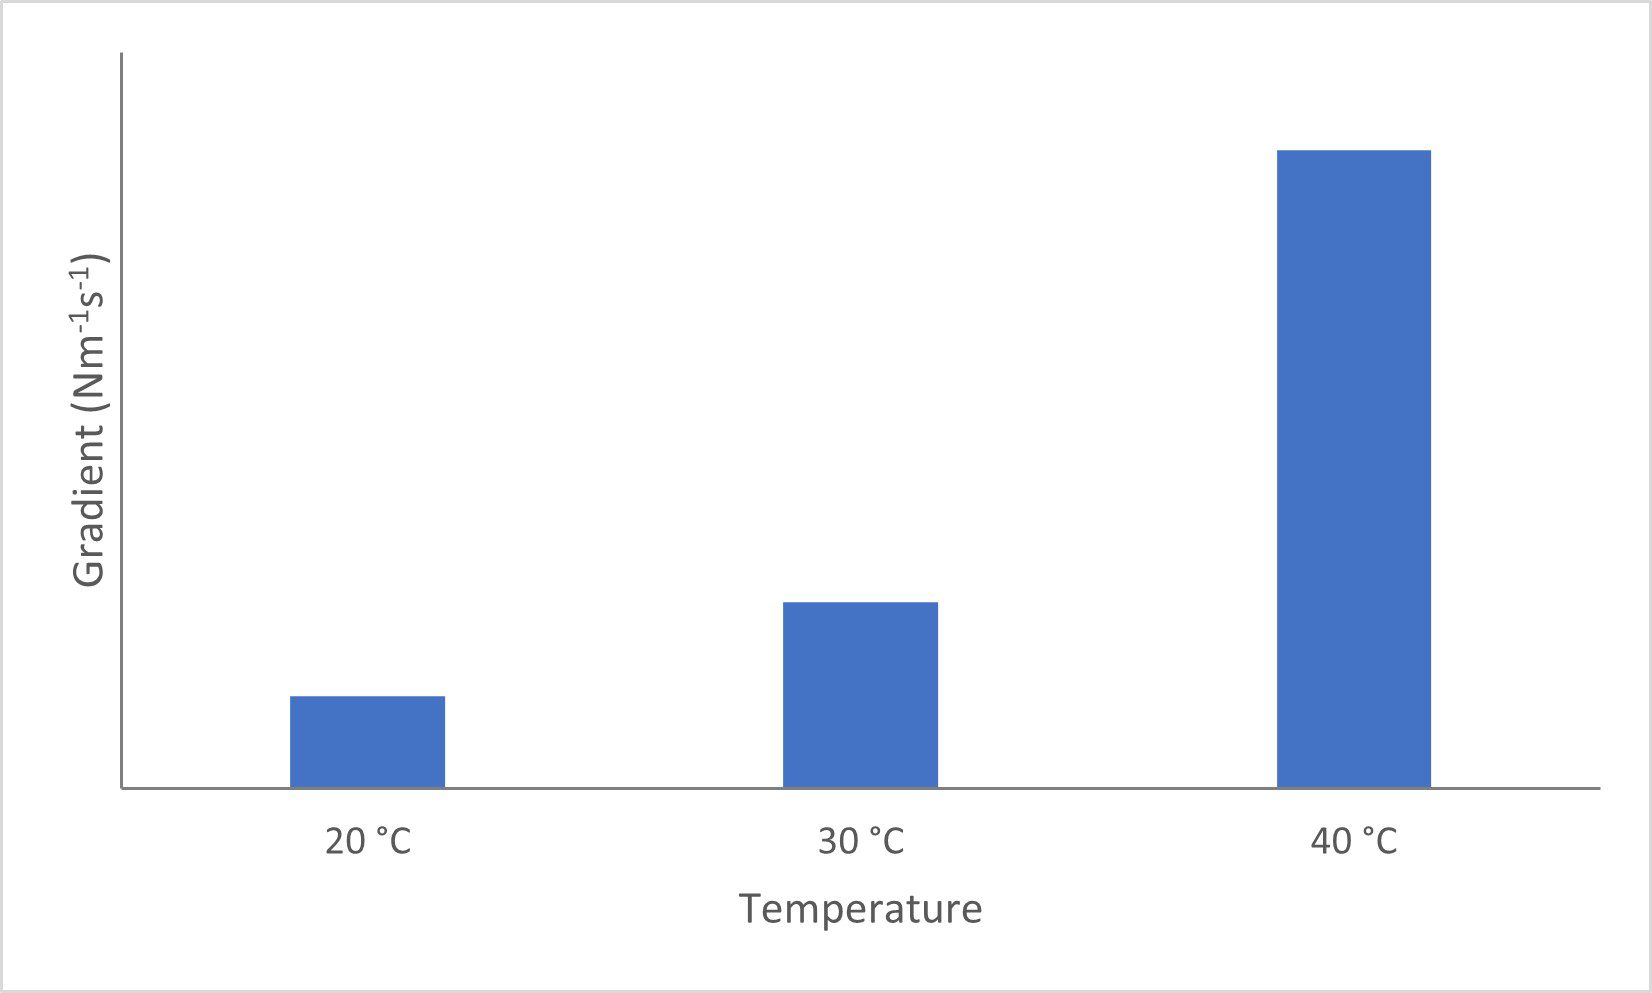
In addition, using the gradient of the complex modulus the rate of film formation can be quantified:
- 40 °C: 2.60 x 10⁻³ Nm–1/s
- 30 °C: 7.59 x 10⁻⁴ Nm–1/s
- 20 °C: 3.74 x 10⁻⁴ Nm–1/s
This differences in rate are clearly shown in the plot below, Figure 2.
Modulus cross-over, another key indicator for film formation
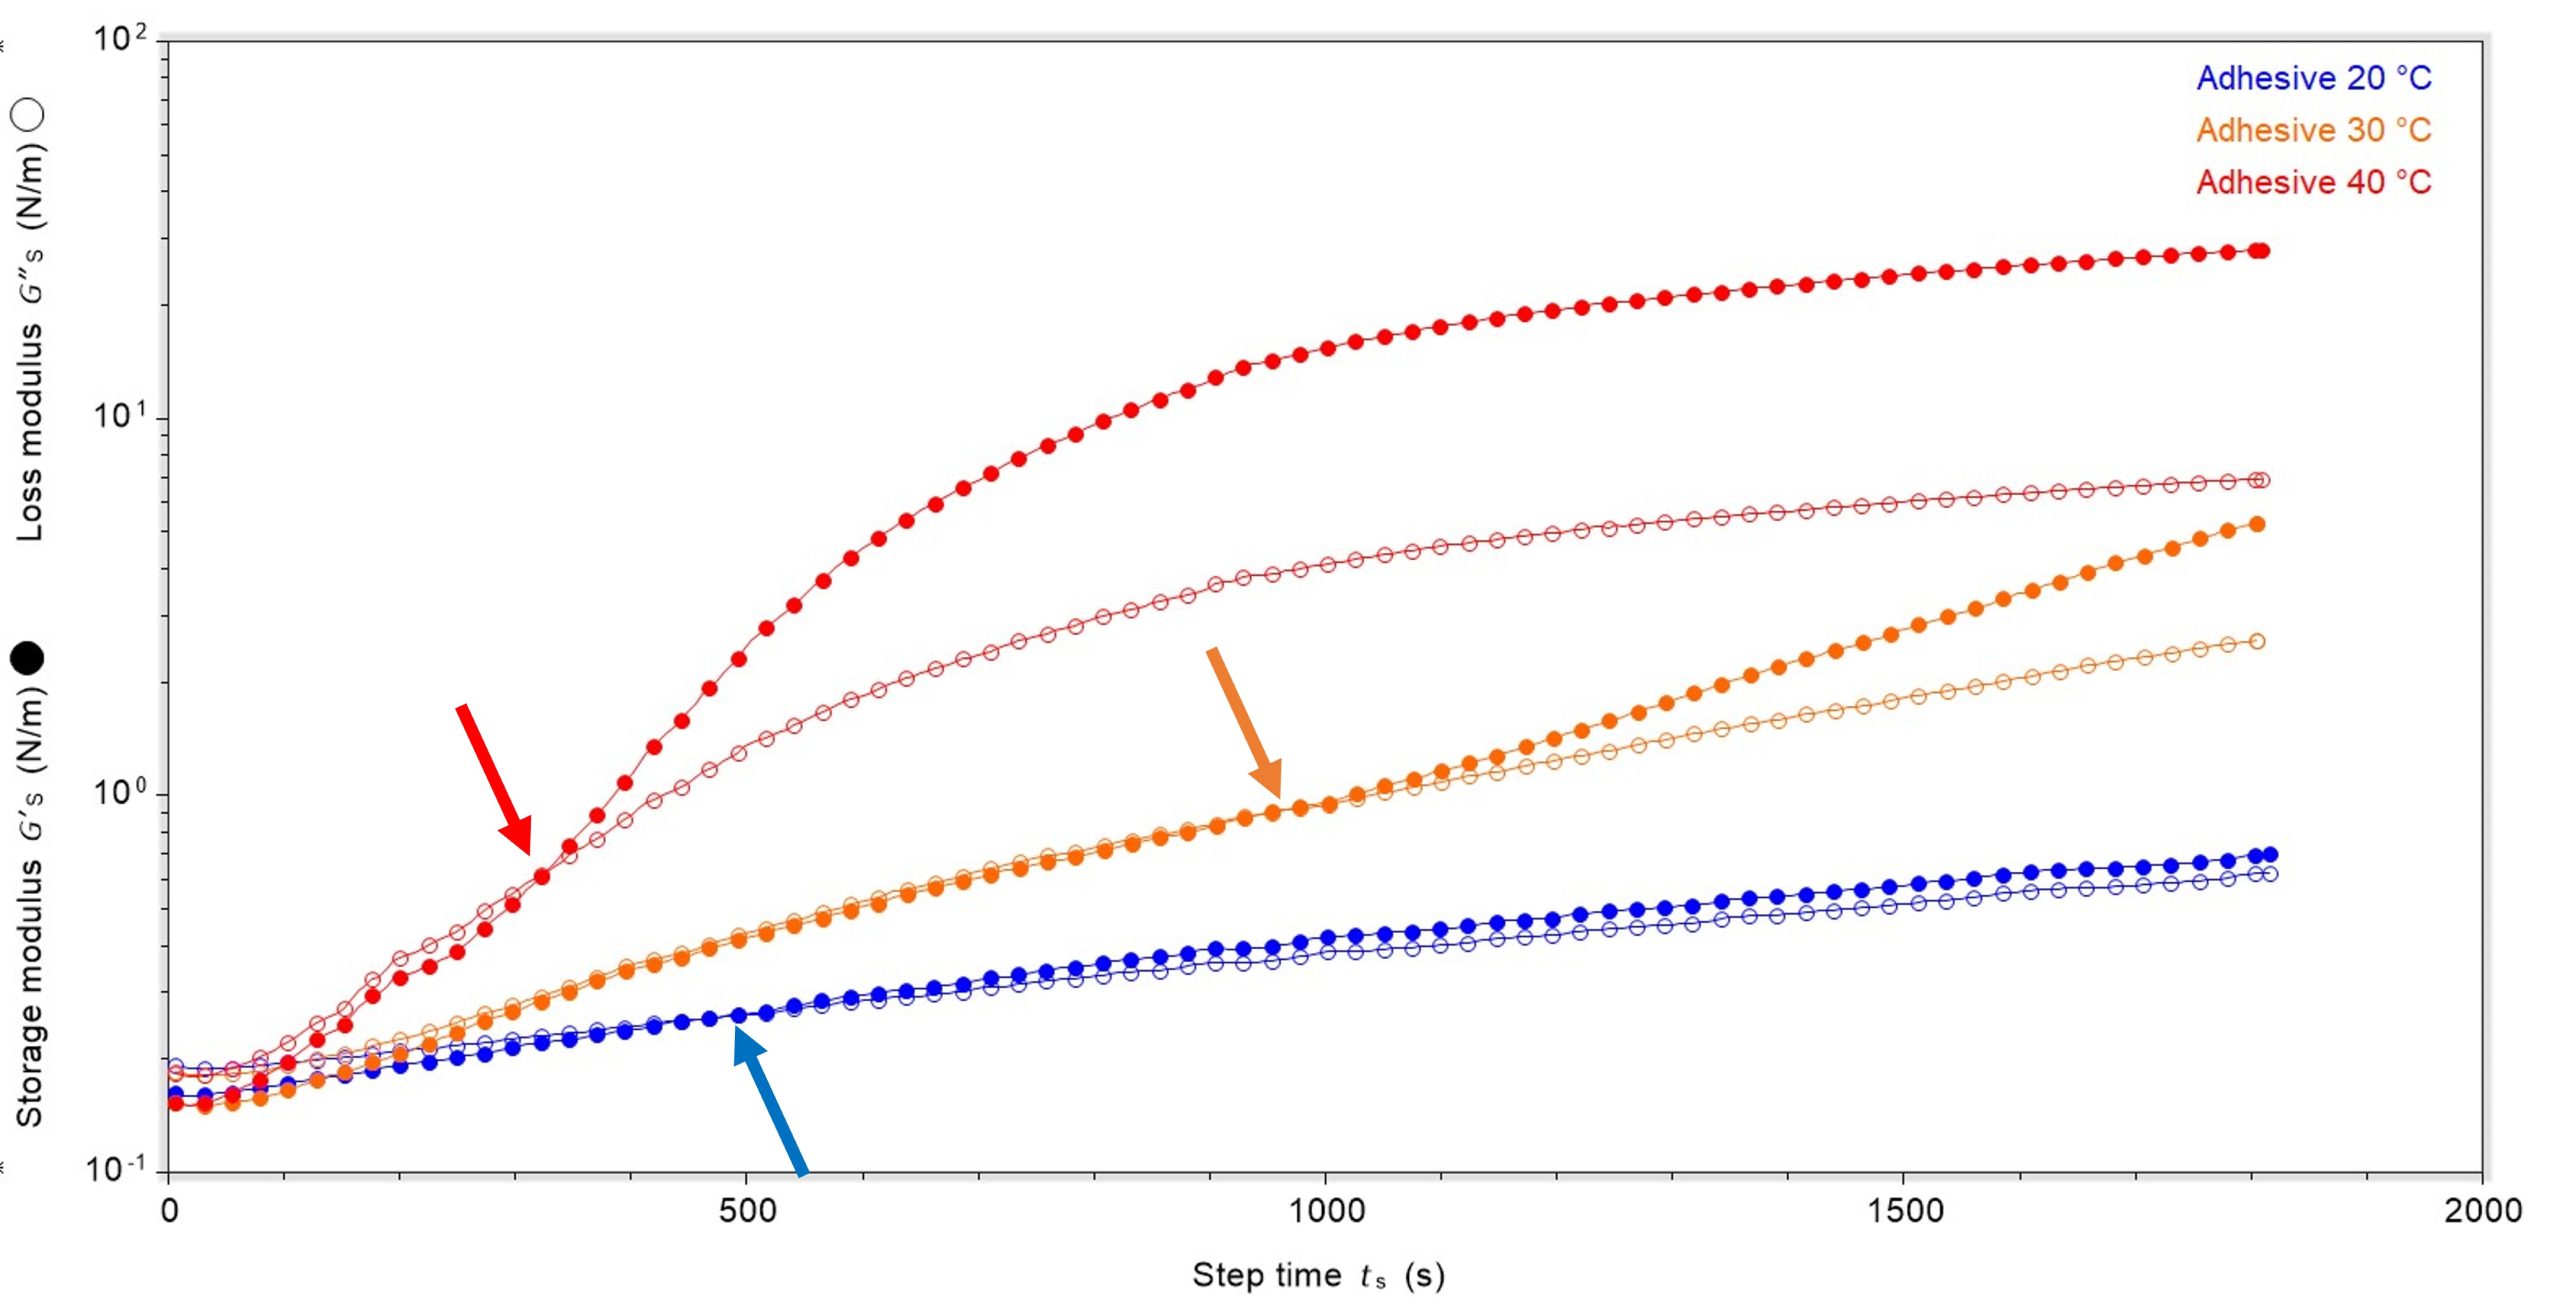
Another useful indicator of film formation is the change in storage and loss moduli. At the temperatures investigated, in all cases the materials had higher loss (viscous) modulus than storage (elastic) modulus before film formation, therefore they were liquid dominant. As curing proceeded, the storage and loss moduli crossed and the materials became solid-dominant, suggesting that a film was forming on the surface. The point at which the storage and loss moduli cross-over, and the storage modulus becomes dominant, can be taken as the point at which a behavioural change has occurred and a thin, but measurable, film has been formed; we call this the onset point of film formation. Any increase in storage and loss modulus (and therefore complex modulus) after this point is due to an increase in rigidity of this film.
Using these data, clear differences between the time taken for a film to form and the rigidity of the film formed were identified. It was noted that the cross-over point for the 40 °C sample was the fastest, at 326 seconds, Figure 3. Interestingly, the 20 °C sample was next fastest at 471 seconds and the 30 °C was the slowest at 944 seconds. However, the time taken to reach the cross-over point is only part of the story and the rigidity of the film formed by the cross-over point was substantially different.
As noted earlier, although the sample at 30 °C took longer to reach the cross-over point, the rigidity of the film formed was highest with complex modulus of 0.89 N/m. The 40 °C sample had the next highest complex modulus at 0.63 N/m and the 20 °C was least rigid upon film formation at 0.26 N/m. This suggests that although a warmer environment may form a film fastest, there is a compromise in the rigidity of the initial film formed, which may have a bearing upon performance. With this particular product the optimum temperature for speed of film formation and strength of initial film may be 30 °C.
It was also noted that until the storage and loss moduli crossed, they were fairly close in value. Once they had crossed, for both the 30 °C and 40 °C samples the difference between the two moduli increased rapidly, with the storage modulus increasing at a faster rate than the loss modulus. In contrast, for the 20 °C sample the two moduli increased at a relatively similar rate after crossing. This is interesting behaviour and shows that at both 30 °C and 40 °C, once film formation had started the solid-contribution (from the storage modulus) increased rapidly, leading to more rapid development of solid characteristics and a more rigid film. Whether this is positive or negative behaviour in terms of product performance is unclear.
Sample curing environment: Probing evaporation effects
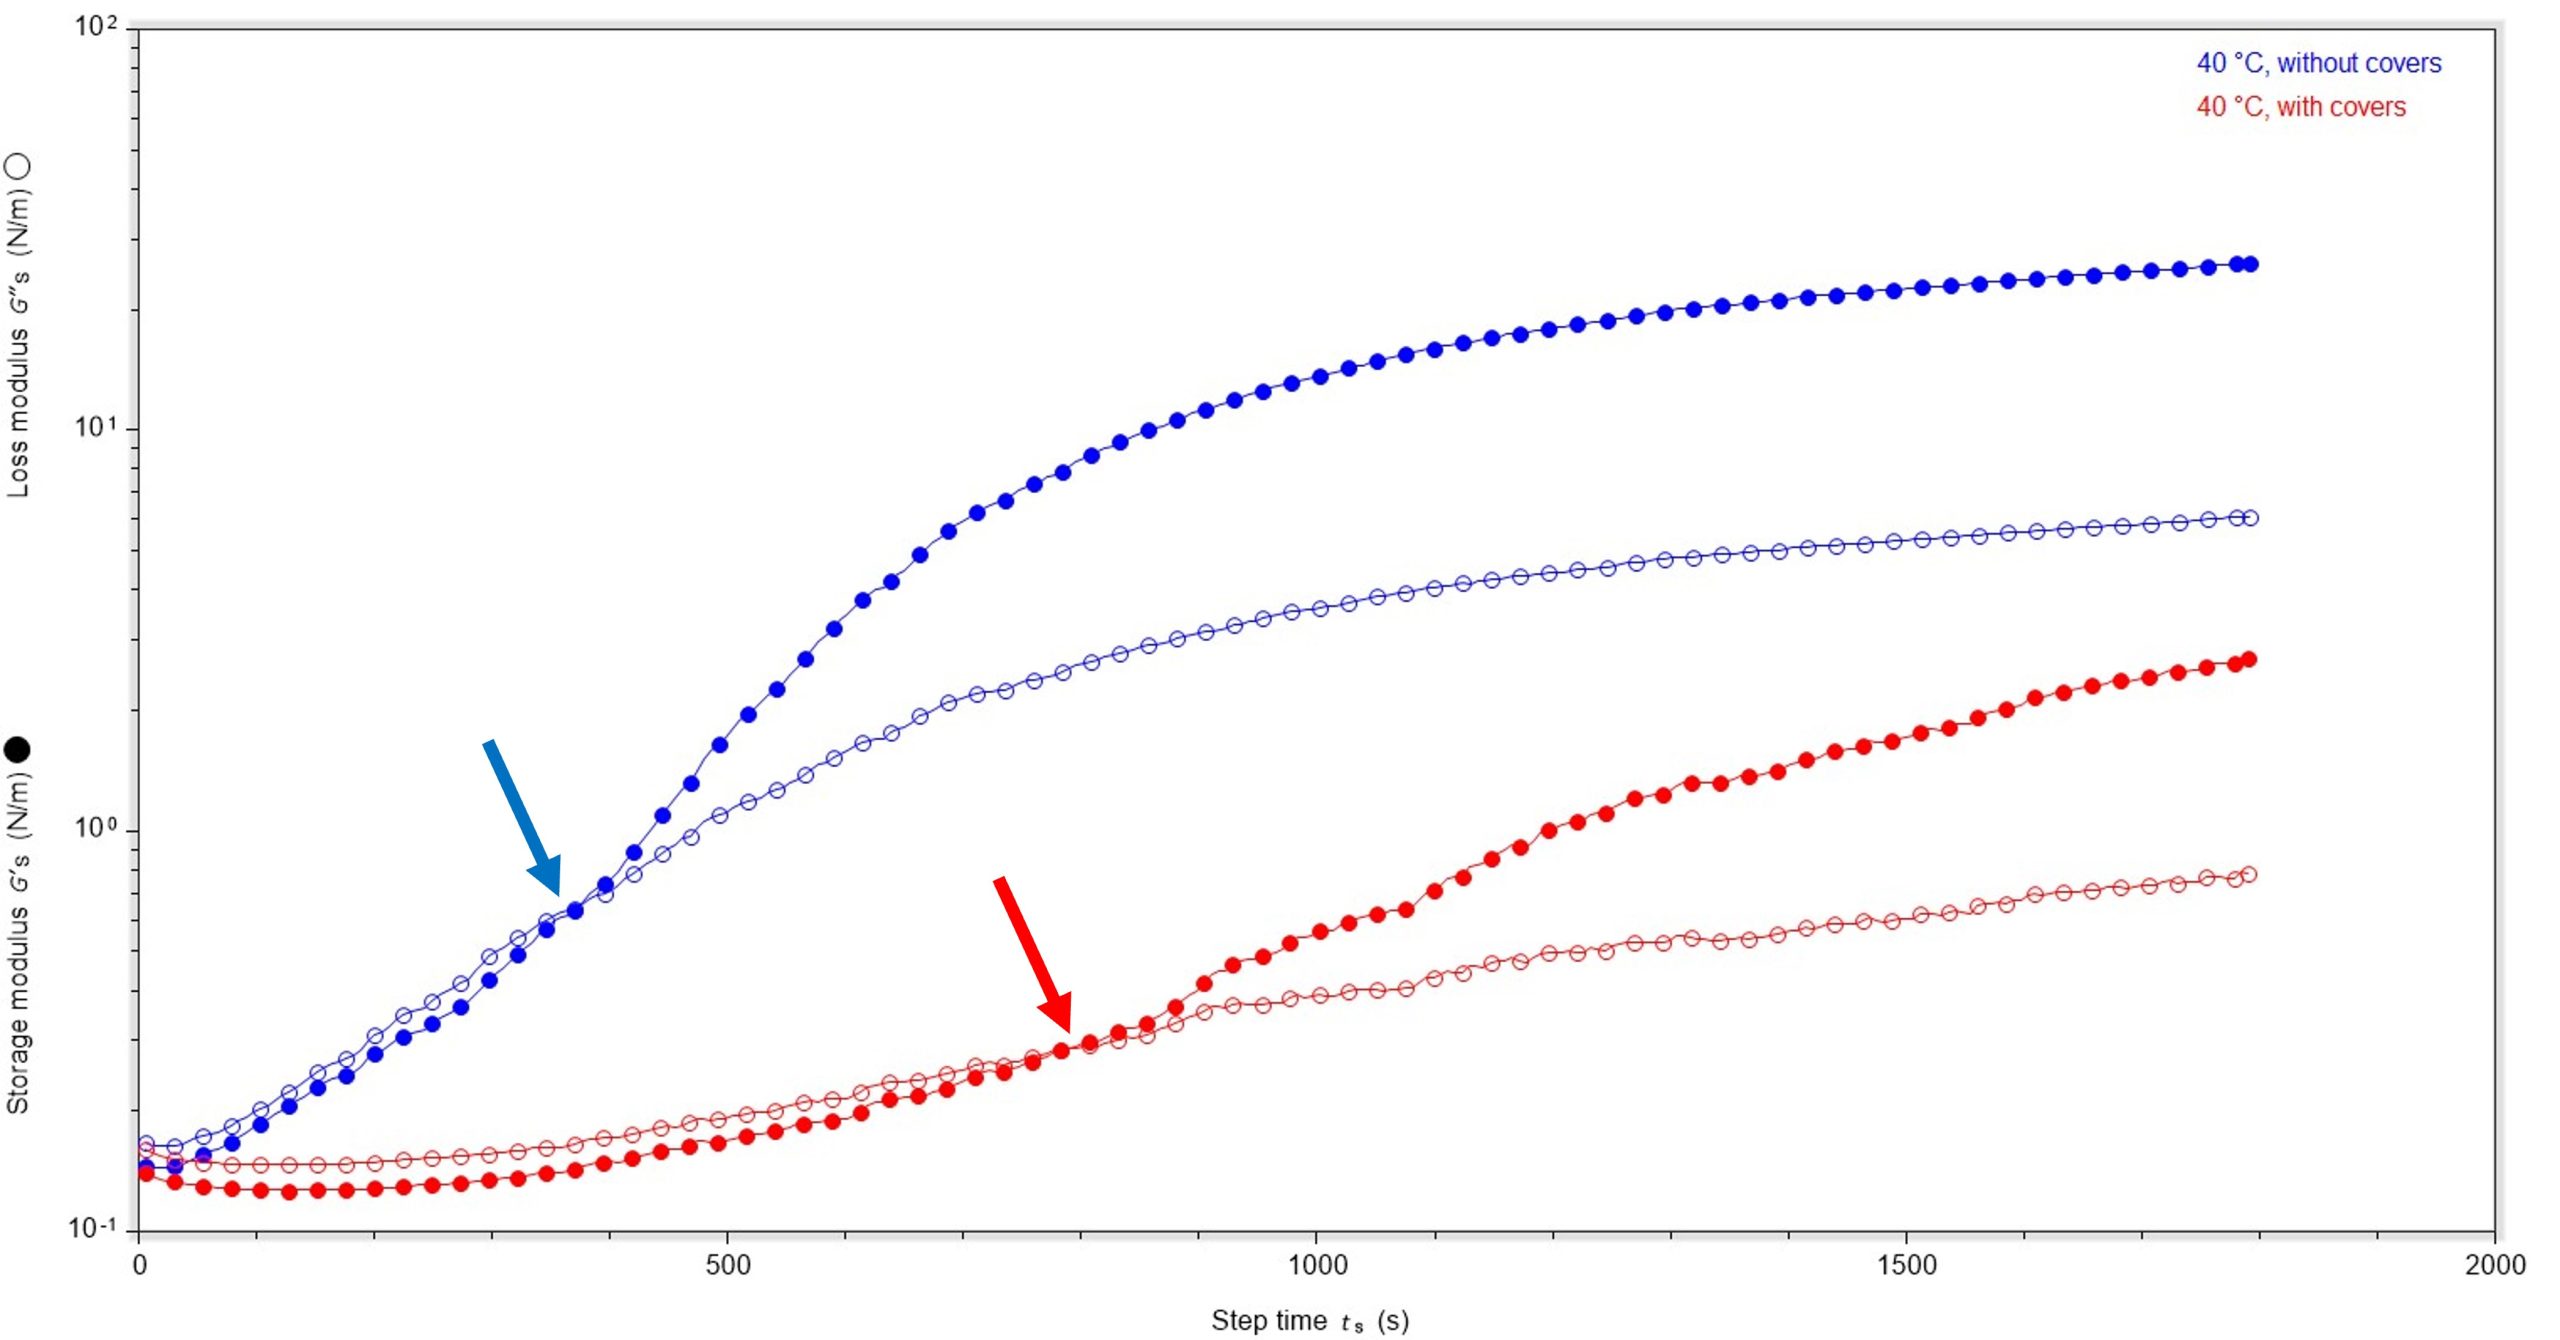
We then looked to compare the film-forming behaviour of the sample during the testing process, and measured data for a covered and an uncovered sample. In the experiments discussed above, the samples were not covered during the curing process to allow for facile solvent evaporation and therefore an increased rate of film formation. Comparing the rate of film formation for covered and uncovered samples would provide insight into whether air-flow to the surface has a bearing on both film formation and the rigidity of the film.
The data clearly show that absence of covers has an impact upon the rate and initial rigidity of the film formed, Figure 4. When cured at 40 °C in the absence of covers, film formation is faster and the initial film formed is more rigid (374 s, 0.65 N/m), whereas when the sample is covered film formation is slower and initially the film is slightly less rigid (786 s, 0.29 N/m).
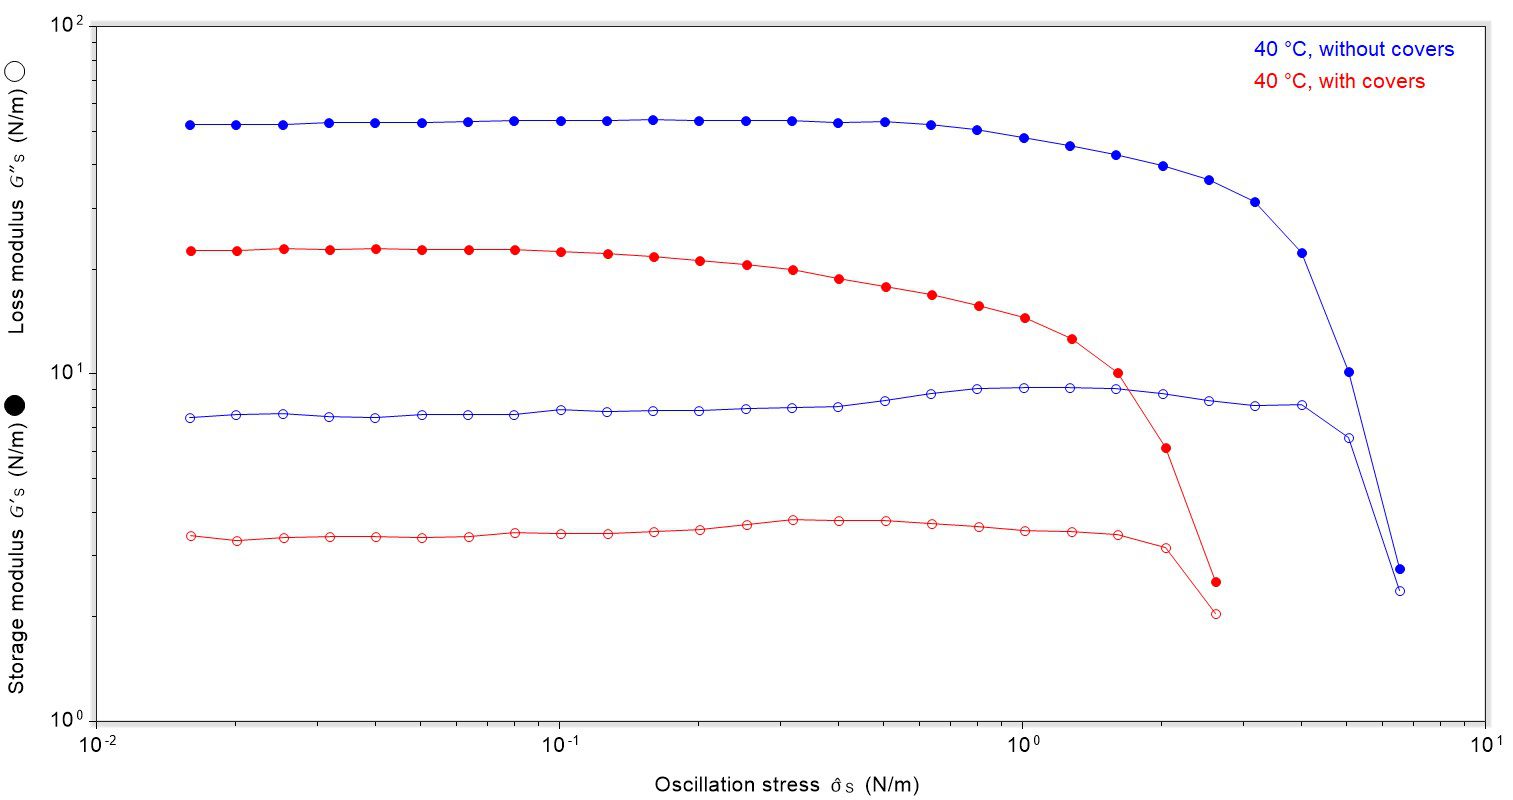
Finally, the strength of the film formed at 40 °C, both with and without covering the sample during testing, was investigated using an oscillatory stress sweep of the film after 2400 seconds. There was a clear correlation between the rigidity of the film and strength, Figure 5. The film formed at 40 °C without covers was more rigid than the film formed with covers (see Figure 4), which is reflected in the yield stress; the less rigid sample had a lower yield stress i.e. required less stress to rupture.
Summary on use of surface rheology
In summary, the use of dynamic surface rheology to monitor film formation provides valuable insight into rate, strength and rigidity of films formed. The data can either be used to compare samples or benchmark against competitors.
For information about the testing performed with surface rheology here, or to talk about other ways that we can help with rheological testing, please get in touch.
Didn’t find what you were looking for? Contact us to discuss your requirements!