
There’s something oddly satisfying about watching toothpaste being squeezed onto a toothbrush. Particularly so, when there’s a well-defined and brightly coloured stripe across the side which then begs the question, how do they get that stripe there? The answer is a combination of clever engineering paired with equally clever formulation work in targeting and managing a specific rheological profile.
If the rheology of the toothpaste wasn’t right, say if the toothpaste just sunk deep into the toothbrush’s bristles, then the consumer may believe – however unjustly so – that they have purchased an inferior product. Getting the right rheology can also have benefits during manufacture – understanding tailing behaviour can reduce fouling of equipment and cut downtime from cleaning.
Let us know if you’d like to talk about our capabilities for understanding toothpaste behaviour.
Toothpastes can have complex rheological behaviours due to the ingredients used in their formulation. Polymers have a reputation for having unusual physical behaviours such as thixotropy, extensional behaviours or other viscoelastic effects – xanthan gum, carrageenan gum, carboxymethyl cellulose and alginates feature frequently in toothpaste formulations and all have an impact on the final observed appearance and handling behaviour.
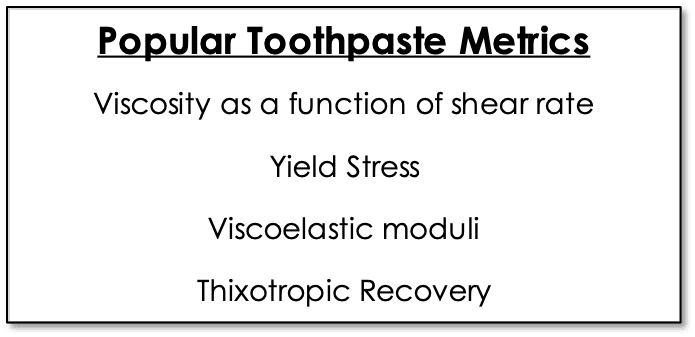
Identifying and choosing the right methods and equipment to help understand some of the toothpaste’s more complex behaviours can be a daunting task. We’ve selected a few choice methods and characterised some popular toothpaste brands to give you an idea of what to expect and what we can do to help.
If you have a specific challenge with the characterisation of your toothpaste or are trying to understand a difficult-to-describe physical behaviour, please feel welcome to contact us.
Toothpaste Structure – Shape, stiffness and edge definition
While the urge to simply squish toothpaste and measure ‘resistance encountered’ is a tempting one (and fun to watch), it’s difficult to identify whether that resistance is a result of a recoverable elastic structure, or simply the viscosity of the material.
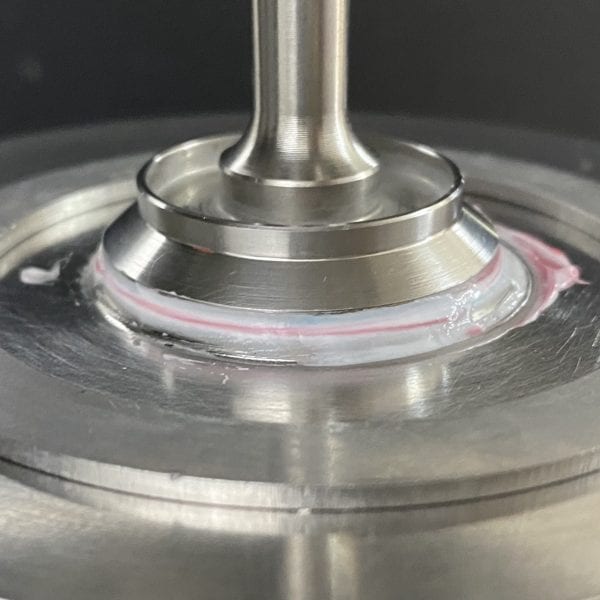
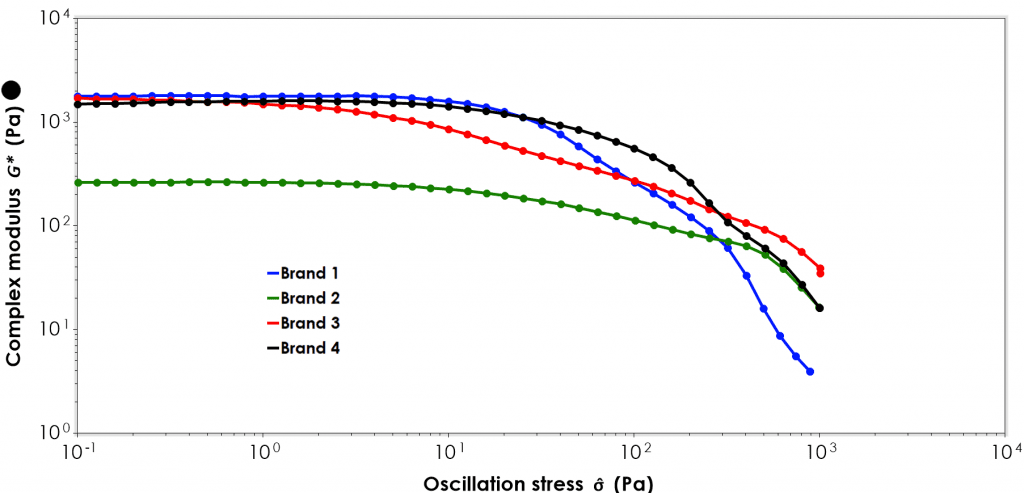
Oscillatory stress sweeps involve gently wobbling a small sample between two plates and measuring the resistance offered under a range of applied strains, or how far the material deforms under a range of applied stresses. One of the benefits of oscillatory testing is that it attempts to minimise the disruption of the structure of the sample, by using low strain values compared to a flow test (or viscosity shear rate sweep). The complex modulus measured from this test tells you about the overall resistance to deformation, higher values mean higher rigidity or resistance.
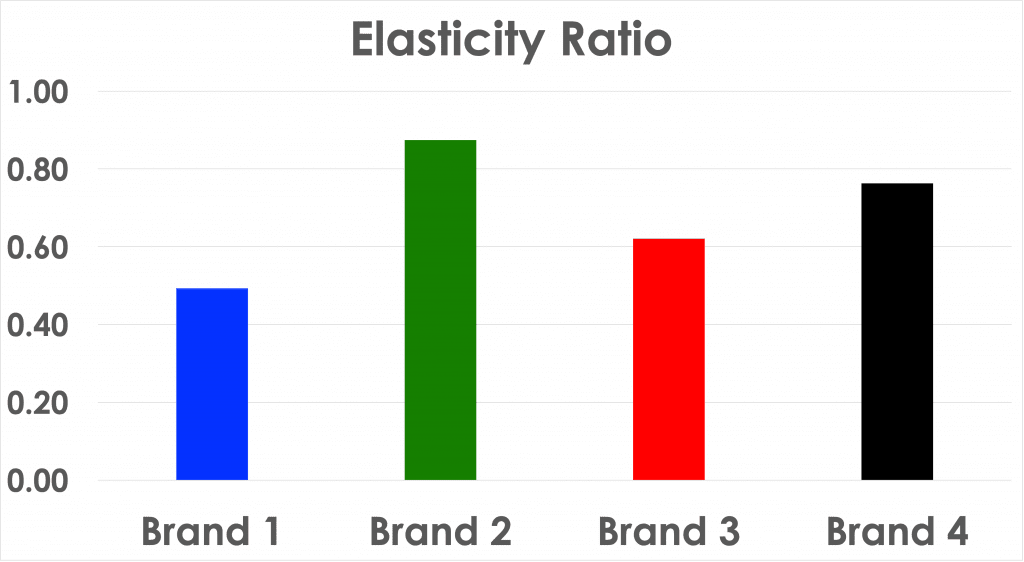
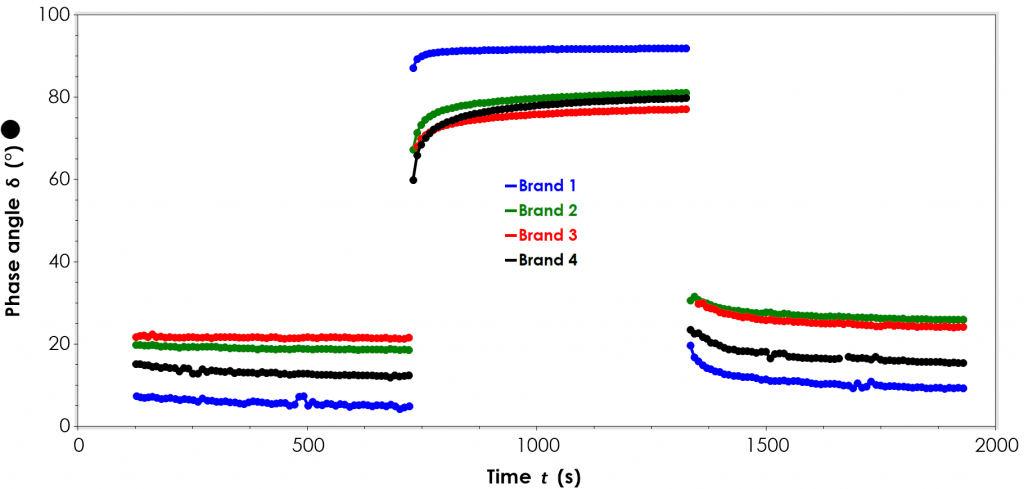
We can also quantify a property known as the phase angle – a measure of the elastic response of the sample. In our lab we like to refer to the test as sort of ‘structure detector’. A phase angle of 0° indicates a perfect elastic response indicating the presence of a fully formed elastic structure, whereas 90° indicates a perfect viscous liquid and lack of any elastic structure. A high enough stress or strain applied to a material will eventually cause permanent deformation to the sample – using oscillatory testing it is possible to identify the transition from elastic (recoverable) to plastic (non-recoverable) deformation.
The stress measured as this transition occurs is often referred to as the yield stress. While presenting yield stress as a single number is useful for comparisons of strength of structure, we should be careful not to oversimplify yielding behaviour since it is better described as a process than ‘an event’ as evidenced in the figure below.
Toothpaste Viscosity – Pumping, processing and oozability
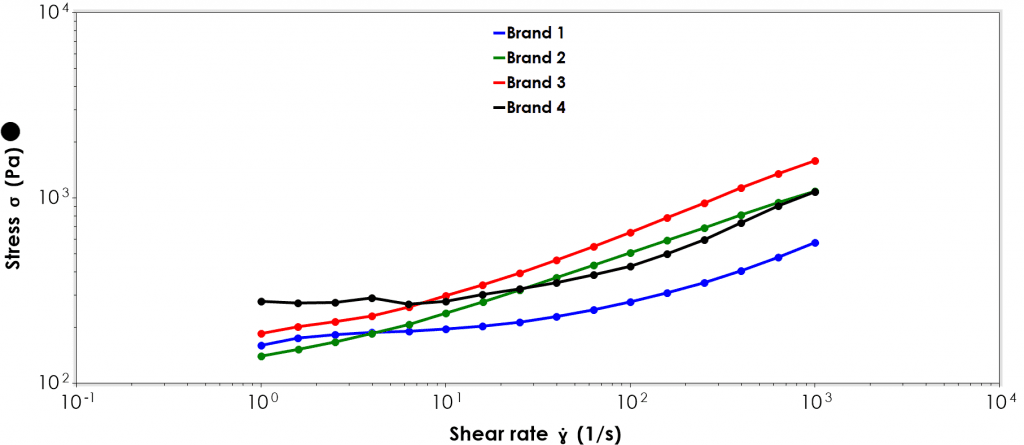
As we often say of non-Newtonian materials, viscosity is a plot rather than a dot – the shear rate applied to toothpaste formulations has a marked impact on the measured viscosity. Understanding the relationship between shear rate and viscosity is important during manufacture – including mixing, pumping and filling – and during customer use.
Toothpastes can be a bit of a pain to measure – disc viscometers struggle to deal with the structured nature of the sample and often it’s not possible to know the exact shear rate applied. Even when using rheometers, toothpastes are prone to slip, edge failure and drying out. A careful combination of test settings, geometries and accessories is paramount to get a truly representative result of the material. At our lab we have a variety of geometries with various surface treatments and other accessories such as solvent traps to deal with a myriad of tough-to-measure samples.
Viscoelasticity and Time Dependency – Stringy, Slimy and Thixotropy
In addition to structure and flow properties, the stringiness of toothpaste is vitally important in quality perception and also for ensuring that whoever is responsible for keeping factory equipment clean does not have an easy job. Many viscoelastic products will also possess a high extensional viscosity, i.e., it will resist being pulled apart. While it is not easy to measure extensional viscosity directly without high-speed cameras, it is possible to collect measurements from easier and simpler tests. Often, when extensional materials are sheared, they generate a normal stress which can be measured with a high-powered rheometer. Considering the growth in normal stress in comparison with the viscosity can give the observer an indication of extensible behaviour like stringing.

If you have ever shaken a bottle of ketchup to make it easier to dispense from the bottle, then you are already familiar with thixotropy also known as time dependent shear thinning. At the lab we like to think about thixotropy as how quickly a material recovers from the application of shear. Ketchup has a high viscosity when at rest and undisturbed. Shaking the bottle disrupts the structure of ketchup and lowers the viscosity. The viscosity doesn’t return back to its original value once the shaking stops, at least not immediately – this slow thixotropic recovery helps keep the ketchup soft giving you enough time to get it out of the bottle and onto your food. A slow thixotropic recovery in toothpastes can cause a problem during manufacture if not accounted for, as thousands of tubes of carefully designed packaging is no longer suitable for the rheology of the toothpaste it contains.
Get help from rheology experts
There are several rheometer-based methods out there that can really help formulators and engineers predict the handling behaviour of their toothpaste. As the perfect texture is honed, exploration into more sophisticated situations such as interaction with salivary proteins seems to be the next logical step in understanding what the perfect toothpaste looks like.
If you would like to discuss this kind of work in more detail, or what we can do to help investigate more complex behaviours like mouthfeel, then please feel welcome to contact us.
Related Articles;
Brush, Foam, Repeat: Not without Interfacial Rheology!