Mouthwash provides a very intimate sensorial experience. Swilling the liquid around the mouth often creates foam, but if too much foam is produced the mouth can feel full, resulting in the need to spit before a useful rinse is complete.
By using dynamic foam analysis, useful information regarding the foaming behaviour of liquids, such as mouthwash, can be gleaned. Important metrics such as foamability (how well a liquid creates foam) and foam stability (how well a foam resists drainage) are easily calculated by measuring the foam and liquid fraction heights of a sample.

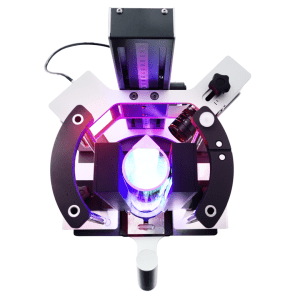
Real-time imaging of the foam structure can also be paired with these measurements for a more in-depth analysis of the foam created by a sample, which provides data regarding the homogeneity of bubble size distribution, as well as rates of increase in bubble size.
This article investigates the role of alcohol in the foamability and foam stability of common over-the-counter mouthwashes. It is directly relevant to formulators in oral- and health-care, but also relevant to those involved with ingredient replacement and where foam generation/decay is a key property of their product.
Mouthwash research and development
Mouthwash in one form or another has existed for over 4000 years; the Greeks and Romans used various solutions containing salt and the Talmud mentions rising the mouth between meals. Modern mouthwashes tend to be antiseptic formulations to kill plaque-causing bacteria which can lead to gingivitis, halitosis, and cavities.
One common constituent of mouthwash is alcohol (ethanol). It is used due to its antiseptic properties and it acts a solvent for active ingredients. However, with some studies suggesting a link between the use of alcohol-containing mouthwash and an increased risk of oral cancer, alcohol-free alternatives may seem a better choice to consumers, especially when evidence suggests the alcohol-containing formulations offer little extra benefit to other active ingredients controlling plaque and gingivitis.
As with many products, altering the formulation of a product to remove or replace an ingredient (in this case, removing alcohol) also changes the properties of the product. Using the dynamic foam analysis methods aforementioned allows for a holistic understanding of how changing an ingredient in a formulation affects its foaming behaviour.
In this study, four different mouthwashes were compared (two containing alcohol, and two alcohol-free):
- NA1 – a high-street chemist own-brand alcohol-free mouthwash
- NA2 – a leading brand alcohol-free mouthwash
- A1 – a high-street chemist own-brand mouthwash containing alcohol
- A2 – a leading brand mouthwash containing alcohol
Neat sample (50 mL) was stirred for 30 s at 4000 rpm using a whisk stirrer head and the foam was then analysed for a further 20 minutes following the end of the whisk cycle.
Comparing the foam height of alcohol and alcohol-free mouthwash samples
The propensity of a product to generate foam can also be called its foamability. A product with poor foamability would produce less foam (smaller height) under the same conditions as one with good foamability.
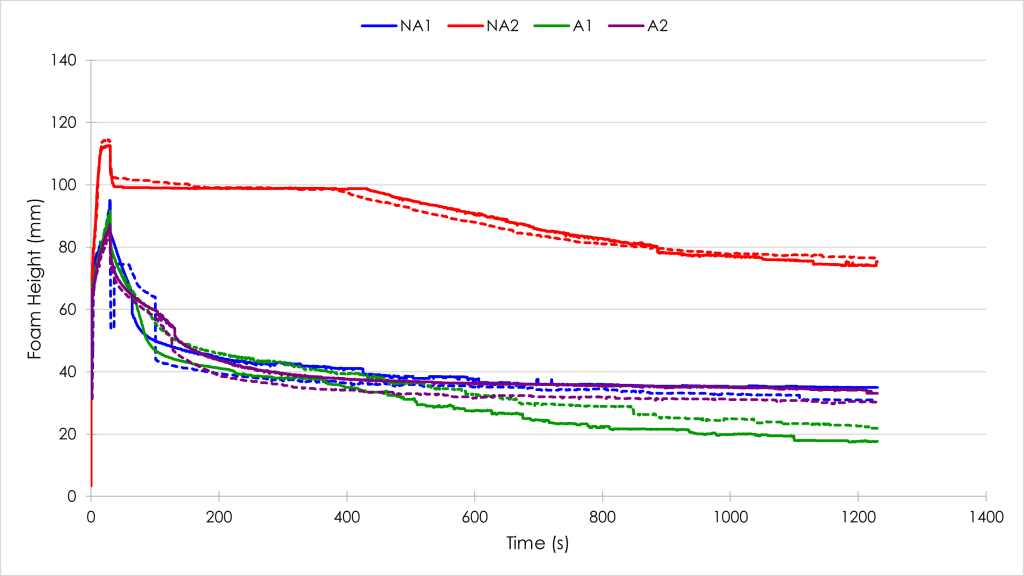
Comparing the alcohol-containing samples (A1 & A2), there was little appreciable difference in their foamability (Figure 1). Both samples reached a foam height of ~90 mm. This was in stark contrast to the non-alcohol samples (NA1 & NA2), which had very different foamabilities. The chemist own-brand non-alcohol mouthwash (NA1) reached a foam height similar to the alcohol-containing samples, but the leading brand non-alcohol sample (NA2) reached a greater foam height of ~115 mm, which indicated a much greater foamability.
Determining foam stability
Figure 1 shows that all four foam samples had a significant drop in foam height following the cessation of whisking. This was attributed to the vortex that formed during whisking and is not an indicator of foam decay.
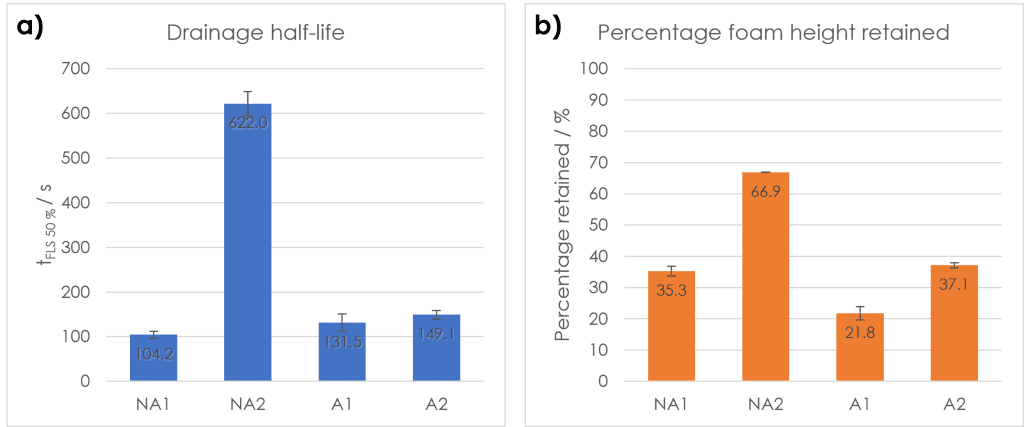
The stability of a foam can be quantified using a range of different methods. One of the most common is to determine the drainage half-life of the foam (time taken for half the volume of liquid contained in the foam to return to the bulk-liquid fraction). A longer drainage half-life indicates a slower foam decay and thus a more stable foam, as more liquid is held in the foam for a greater length of time. By looking at Figure 2a, it can be seen that the NA2 foam had by far the longest drainage half-life of the four samples. This is in direct contrast to the other non-alcohol mouthwash (NA1), which had the shortest half-life of the four mouthwash foams. The two alcohol-containing mouthwash foams (A1 & A2) had similar drainage half-lives, both longer than NA1.
Another indicator of foam stability is the percentage of foam height retained from the maximum; a higher percentage retained signifies a more stable foam as less foam decays, resisting drainage and top-down collapse. As with half-life, the leading brand alcohol-free mouthwash foam (NA2) was the most stable as regards percentage retention of foam height. The mouthwash foam which decreased most, however, was from the alcohol-containing chemist own-brand sample (A1). This differed from the half-life metrics, as the foam sample with the shortest half-life (NA1), decreased less in height than the sample A1 foam. This suggests that although the foam from sample NA1 had a faster initial decay rate, more foam from the sample was retained overall.
Capturing foam structure
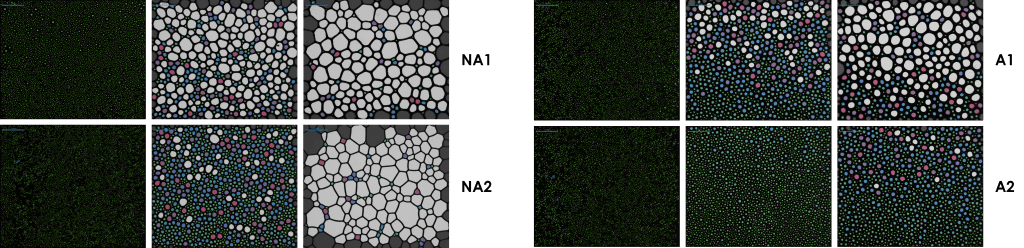
The effects of drainage and bubble size growth have a marked influence on the structure of a foam. The foam analyser allows for the structure to be captured visually to determine the bubble size distribution with respect to time. Figure 3 shows how the structure of the mouthwash foams change over time.
In summary, foam analysis was performed on mouthwash samples both containing and omitting alcohol from the formulation. It was seen that alcohol-free mouthwashes can have similar foaming properties compared to those which include alcohol, which is useful for consumers looking to switch to an alcohol-free alternative with a similar sensory profile to the alcohol-containing product.
Conducting comparative studies such as this can help reduce the need for sensory panels by allowing samples to be compared to successful/current formulations or rival products by repeatable, quantitative methods.