 While the last 10 years have witnessed the growing popularity of vegan diets, the shift from dairy to plant-based products presents formidable challenges for food and ingredients manufacturers.
Rheo-microscopy emerges as a tool in addressing these challenges. This advanced analytical technique plays a role in the comparison of plant-based products to their dairy counterparts, facilitating the improvement of vegan food products.
With the aim of producing melt profiles for vegan cheeses and their dairy counterparts, the Centre for Industrial Rheology procured two dairy-based cheeses and two plant-based cheeses, which were each subjected to rheological-microscopy tests at sweeping temperatures under fluorescence staining. The melt profiles produced show a clear difference in the behaviour of dairy-based cheeses and their vegan alternatives.
Samples & Preparation
Four cheese types, D-Cheddar, V-Cheddar, D-Slice, and V-Slice we tested.

Two fluorescent dyes were used to stain the cheeses separately: Nile Red (NR) to stain lipids and Acridine Orange (AO) to stain carbohydrates. NR was made up to a 1:1000 w/w solution in acetone and AO was a 2% solution in H2O. Two 20 μL drops were used to stain the cheeses, which were then covered with a coverslip and chilled overnight. The samples were then rinsed with the respective solvents and dried before testing.
Measuring the Melt Profiles
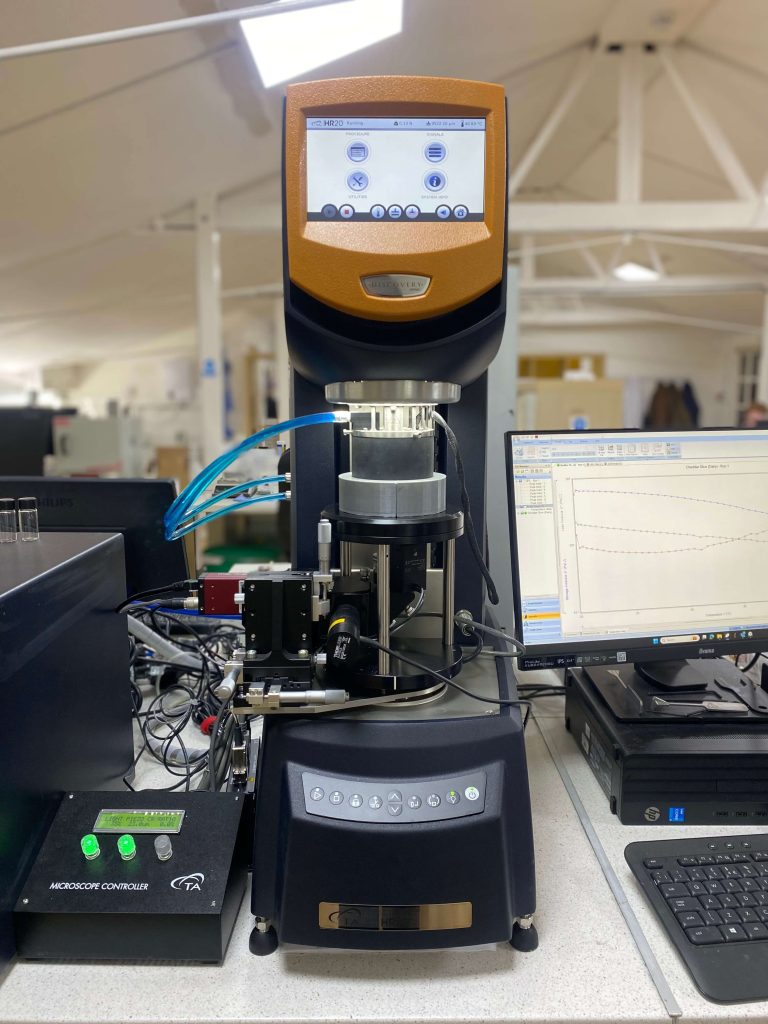
We conducted temperature sweeps of 20-80-20-80-20 °C under oscillation whilst simultaneously capturing images of each cheese at 40X magnification using a dichroic fluorescence filter. The oscillation test allowed us to observe the fluctuation in complex modulus as each cheese sample undergoes melting and cooling cycles. Complex modulus (G*), defined as the resistance to deformation (rigidity), elucidates the cheese’s response to temperature variations throughout the experiment.
Dairy-based Cheddar & Vegan ‘Cheddar’ Melt Profiles
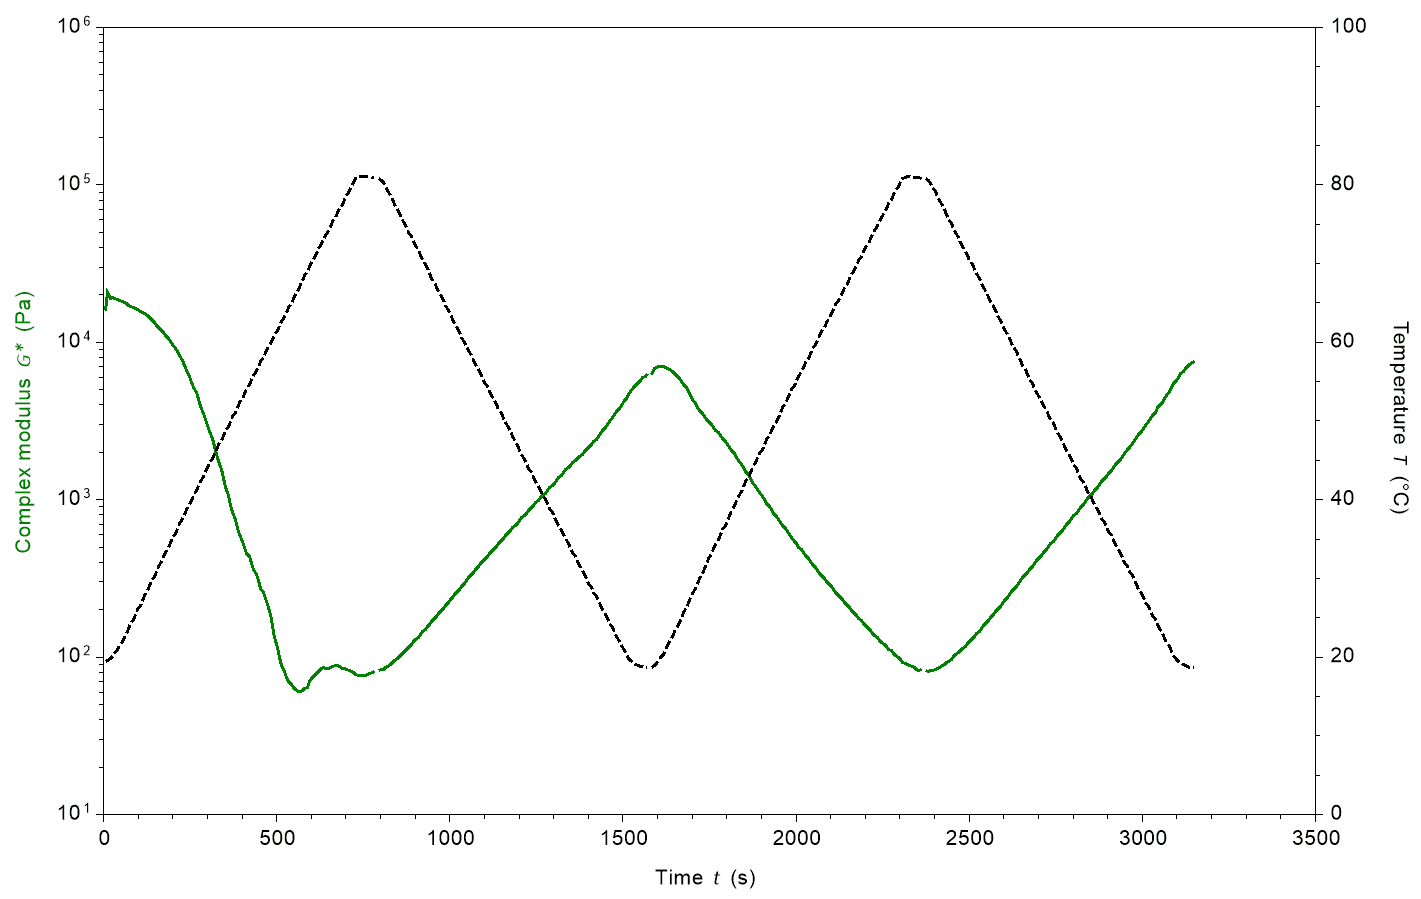 Figure 1: Complex Modulus curve for dairy-based cheddar. | 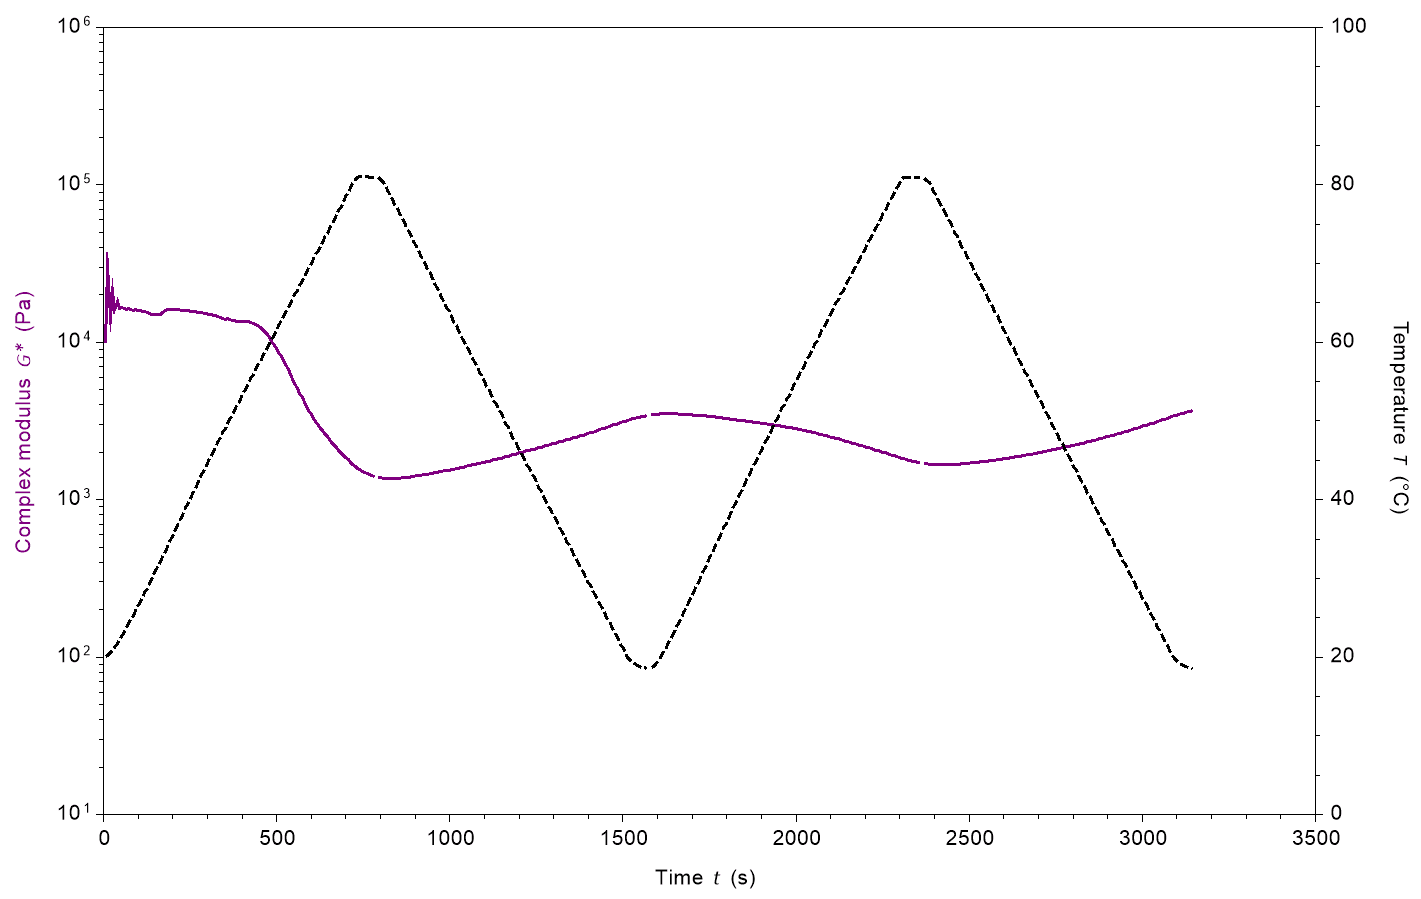 Figure 2: Complex Modulus curve for plant-based cheddar. |
Figure 1 and Figure 2 demonstrate similar behaviours in both the D-Cheddar and V-Cheddar during the initial temperature rise from 20 °C to 80 °C. The complex modulus, or rigidity, of both D-Cheddar and V-Cheddar significantly decreases, reflecting the melting behaviour of these cheddars. Both dairy and vegan cheddars melt under their first exposure to increased temperature.
On cooling the cheddars, we begin to see a difference in behaviour between the two cheddars. The complex modulus of D-Cheddar almost returns to its original value, whereas the complex modulus of V-Cheddar increases to a lesser extent as the temperature returns to 20 °C. It could be assumed that the initial exposure to heat has altered the structure of V-Cheddar.
The complex moduli of both D-Cheddar and V-Cheddar exhibit correlation with the temperature fluctuations of the second temperature ramp. The complex modulus values do not decrease to the same extent as they did in the first temperature ramp, indicating that the cheddars become less soft on the second heating. When cooling the complex moduli return to the values from before the second temperature increase.
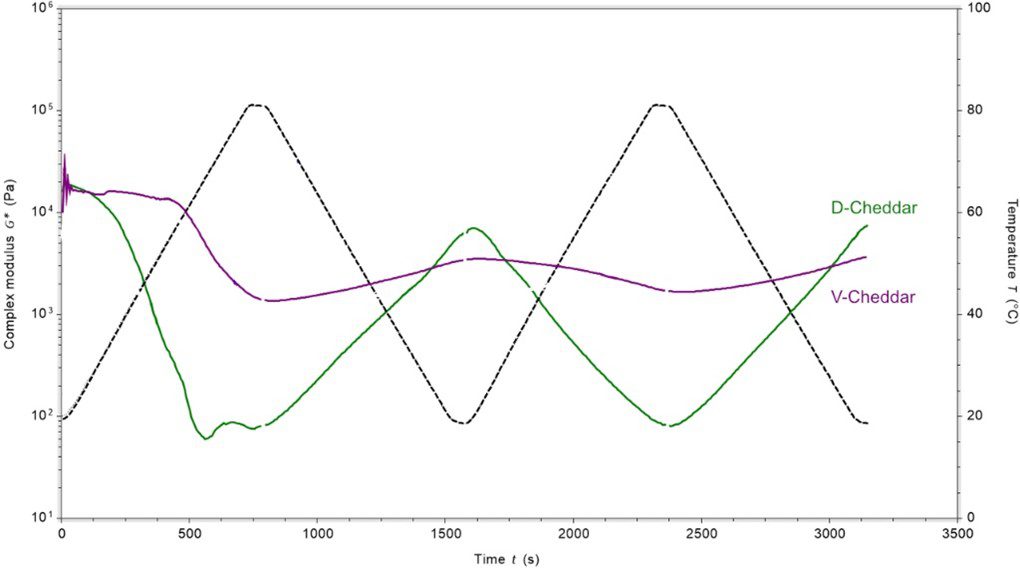
Figure 3 highlights the similarity between D-Cheddar and V-Cheddar on the initial temperature up-ramp and the difference thereafter.
Rheo-microscopy: Seeing the Structural Changes
The rheological data obtained from the oscillation sweep test illustrates the behaviour of the dairy-based and plant-based cheddars, yet it does not provide a rationale for such behaviour. Rheo-microscopy allows us to see structural changes in the cheddars in real-time.
Nile Red Lipid Staining
Dairy-based Cheddar: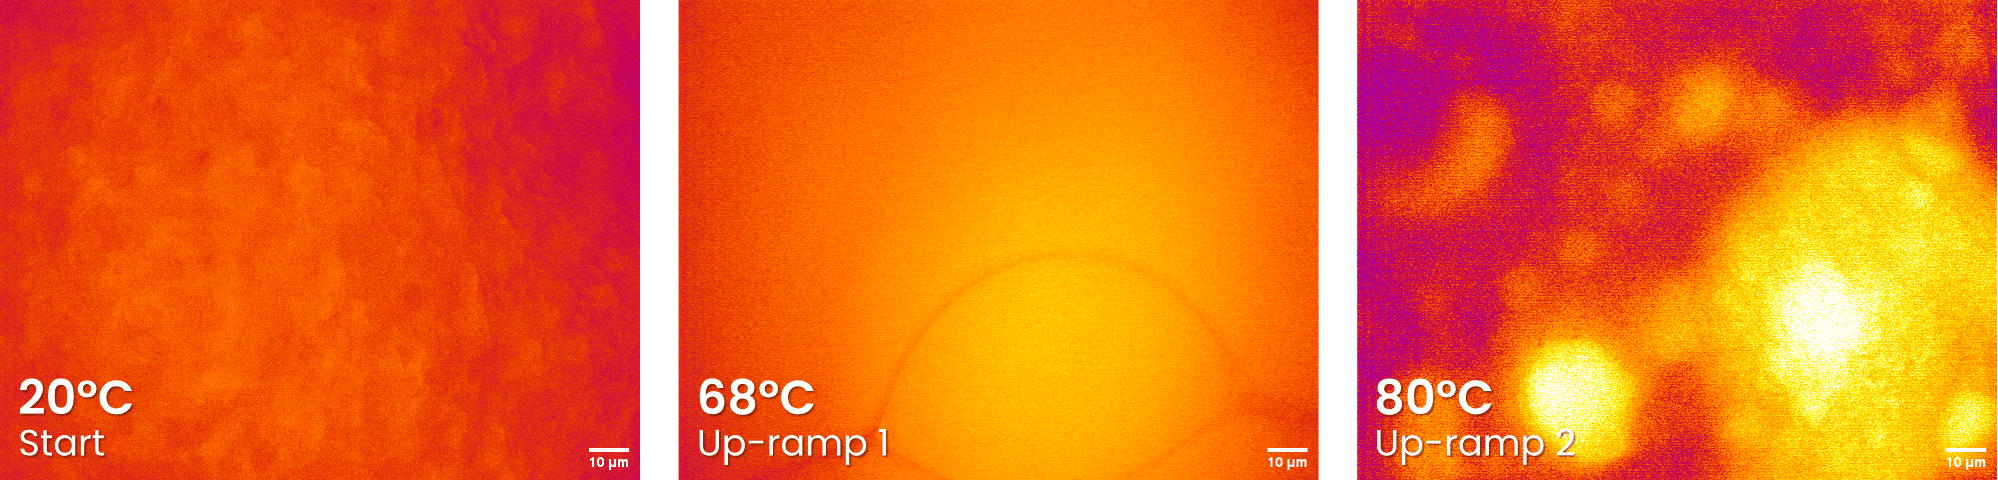
Plant-based Cheddar: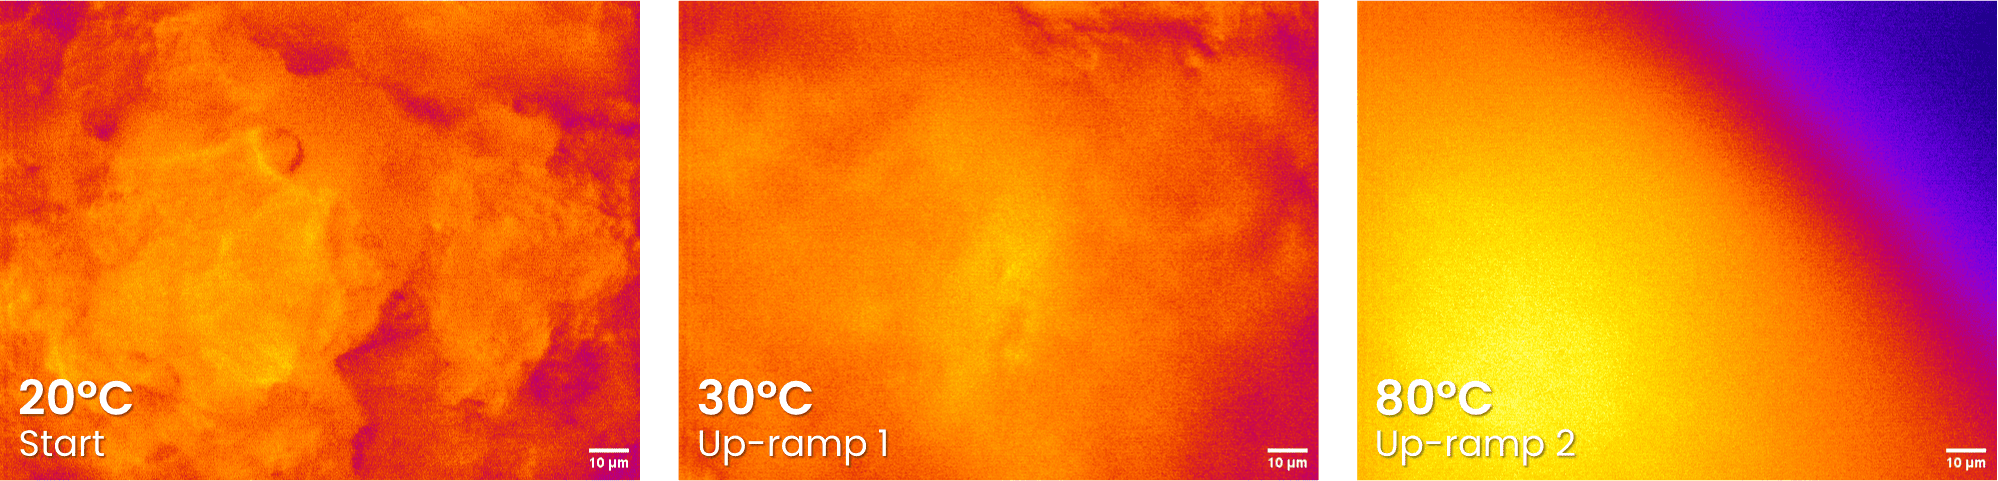
Acridine Orange Carbohydrate Dye
Dairy-based Cheddar: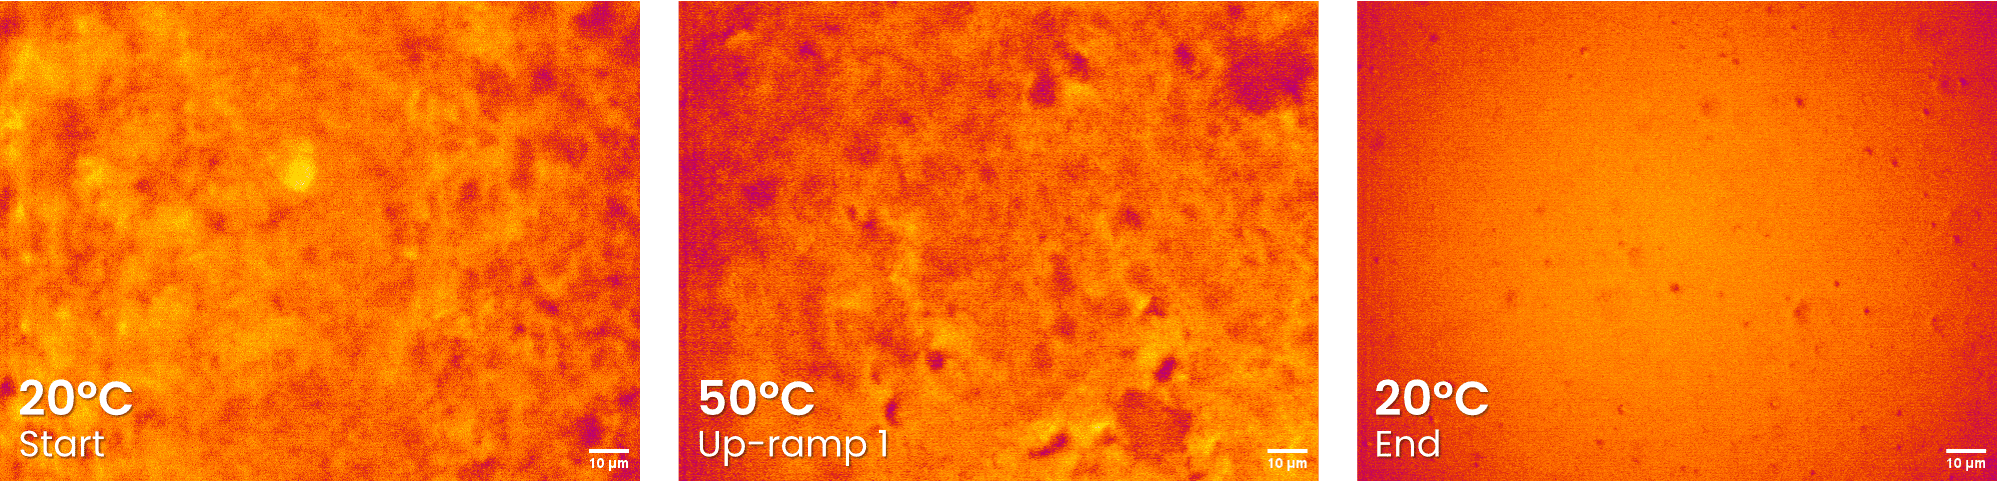
Plant-based Cheddar: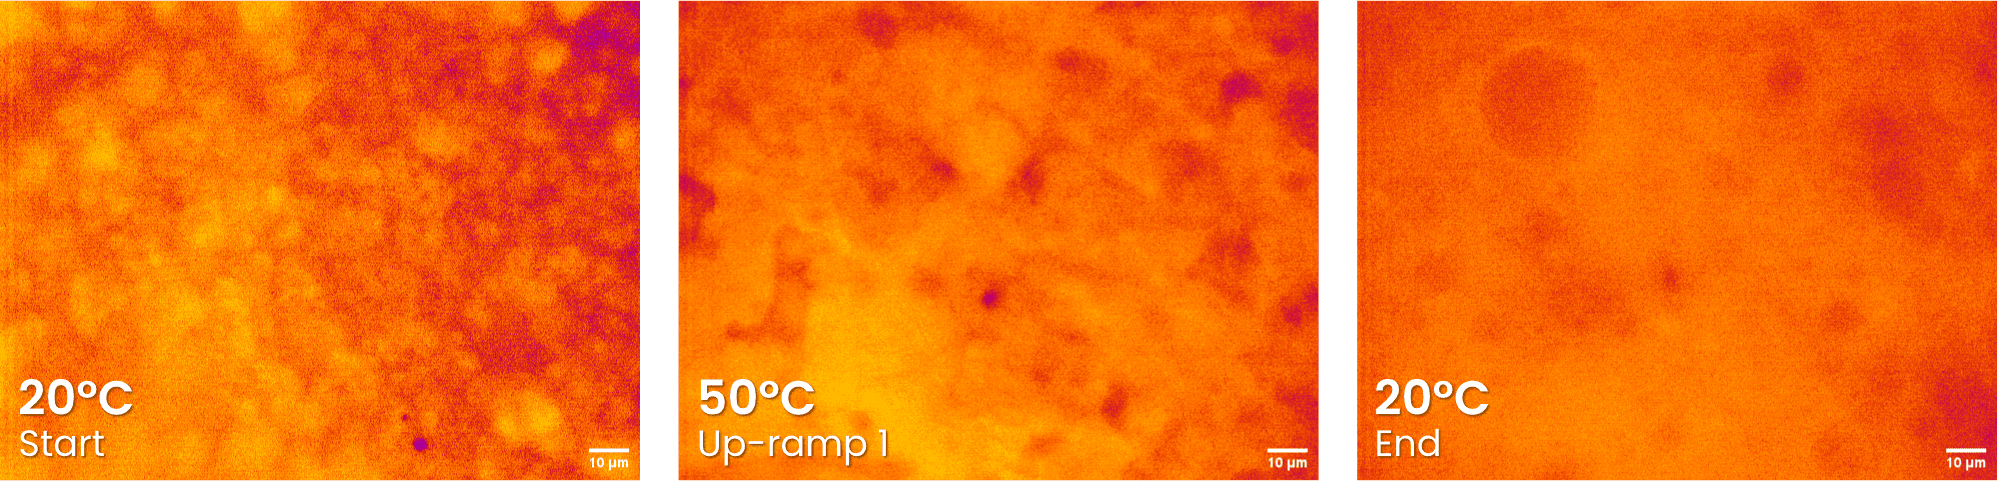
The images capturing the melting/cooling process of cheddars enable us to observe alterations in lipid and carbohydrate structures amidst temperature variations. When examining the lipid structure, D-Cheddar and V-Cheddar exhibit distinct differences despite being at comparable test stages. On the other hand, the Acridine Orange carbohydrate stain reveals structural similarities between the two cheddar samples at similar test stages.
Dairy-based and Plant-based Processed Slices
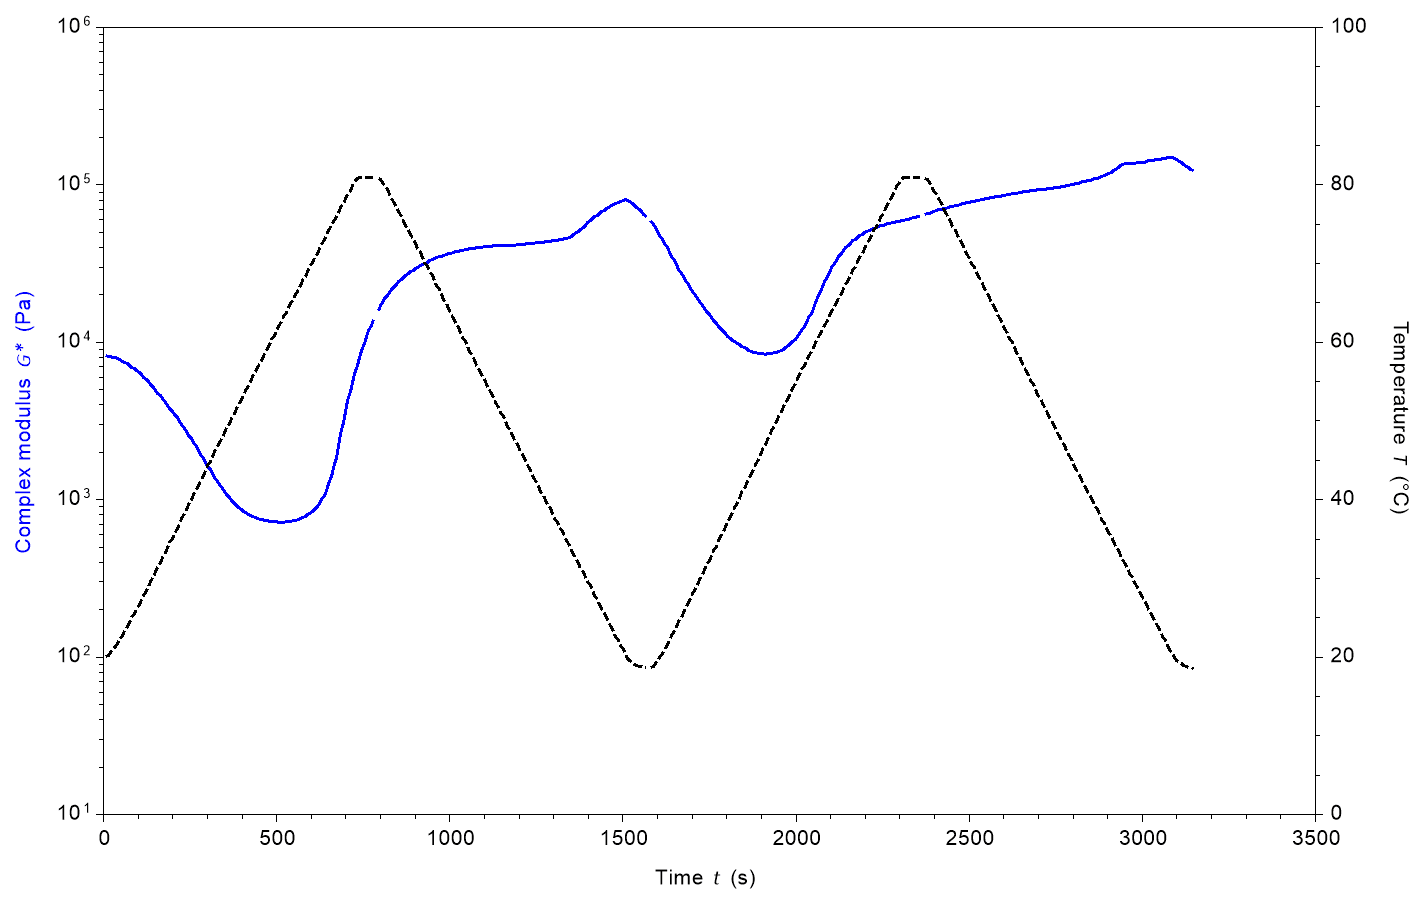 Figure 4: Complex Modulus curve for dairy-based slice. | 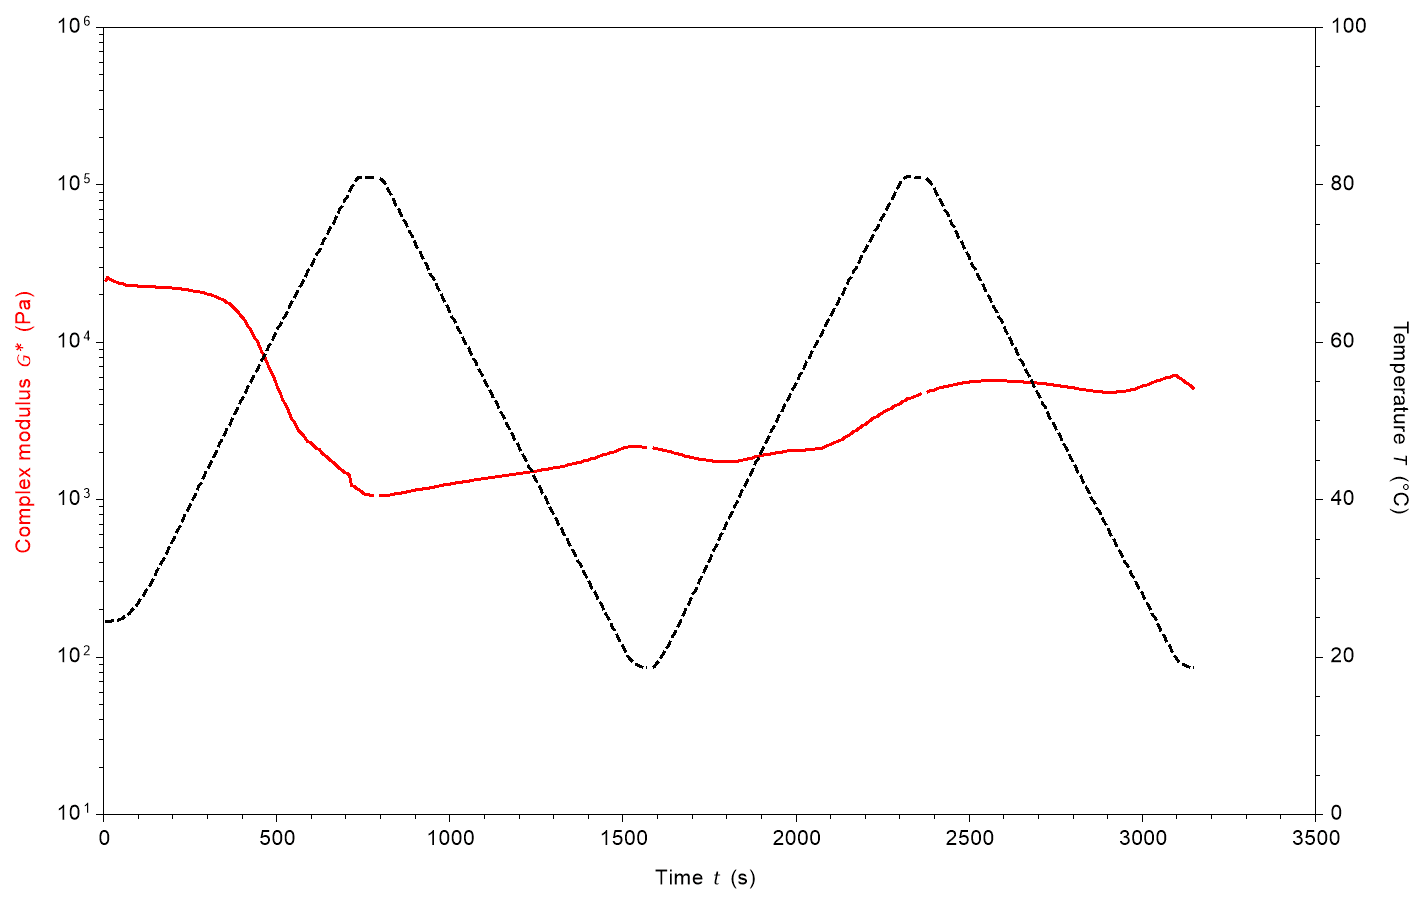 Figure 5: Complex Modulus curve for plant-based slice. |
Figure 4 shows that D-Slice has a very different melt profile to D-Cheddar. Whilst D-Cheddar exhibits melt/softening and hardening behaviour which corresponds to the temperature sweeps, D-slice shows melting behaviour until around 55 °C/500 seconds, at which point the complex modulus begins to increase with the temperature still increasing. This G* increase continues throughout the following cooling ramp until the second heating stage causes a second melt/softening until the G* begins to increase again at around 55 °C/1900 seconds and continues until the end of the test. Ultimately, after both temperature ramps, the complex modulus of the cheese slice concludes notably higher than its initial value.
Figure 5 depicts the melt behaviour of V-Slice, which follows the anticipated melting pattern during the initial temperature increase, with the complex modulus declining as temperatures rise. Upon the temperature decrease, the complex modulus of V-Slice shows an increase but fails to return to its initial value. Subsequently, during the second temperature ramp, although the complex modulus initially decreases, it later starts to rise despite the ongoing temperature increase.
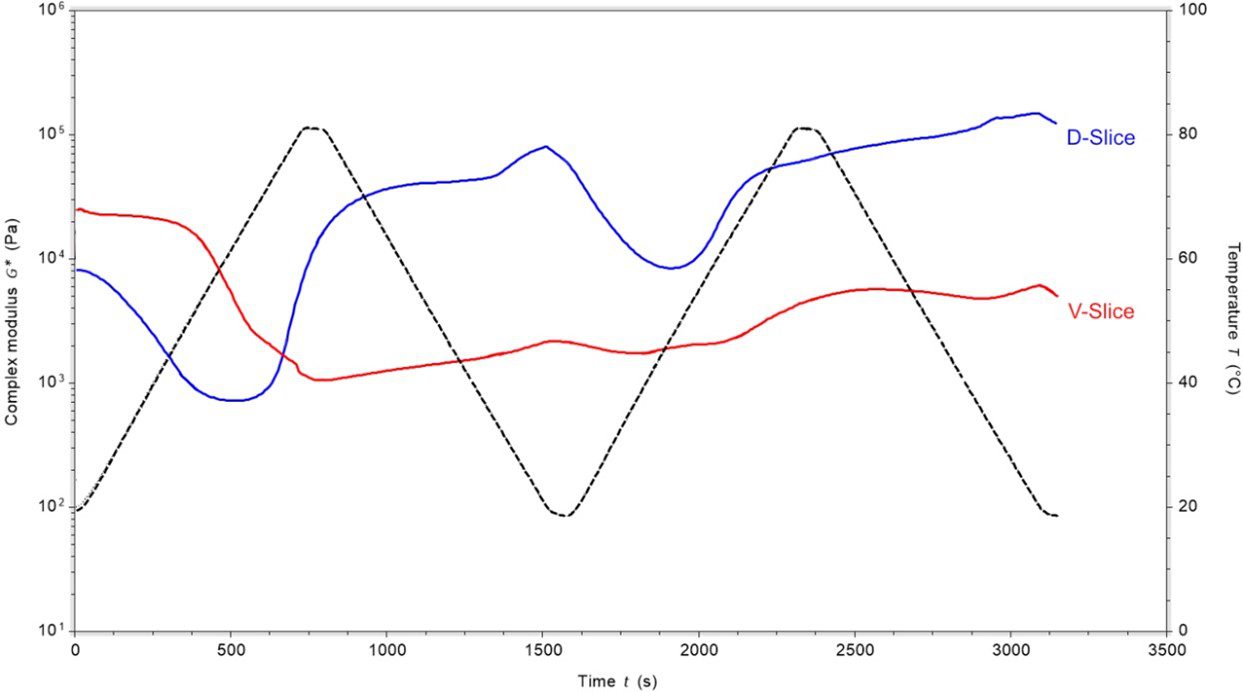
Figure 6 emphasises the resemblance in behaviour between D-Slice and V-Slice during the initial temperature increase and the final temperature decrease.
Rheo-microscopy: Seeing the Structural Changes
Nile Red Lipid Staining
Plant-based Slice: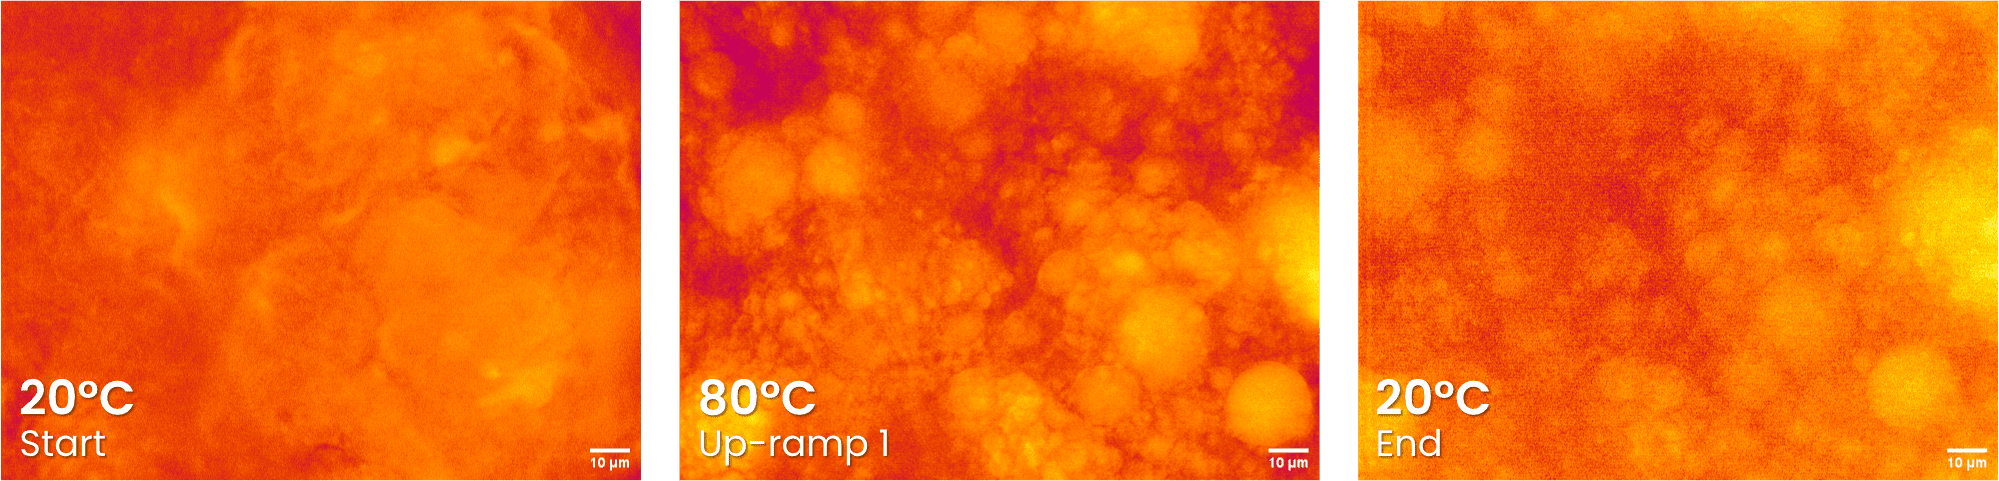
Acridine Orange Carbohydrate Dye
Dairy-based Slice: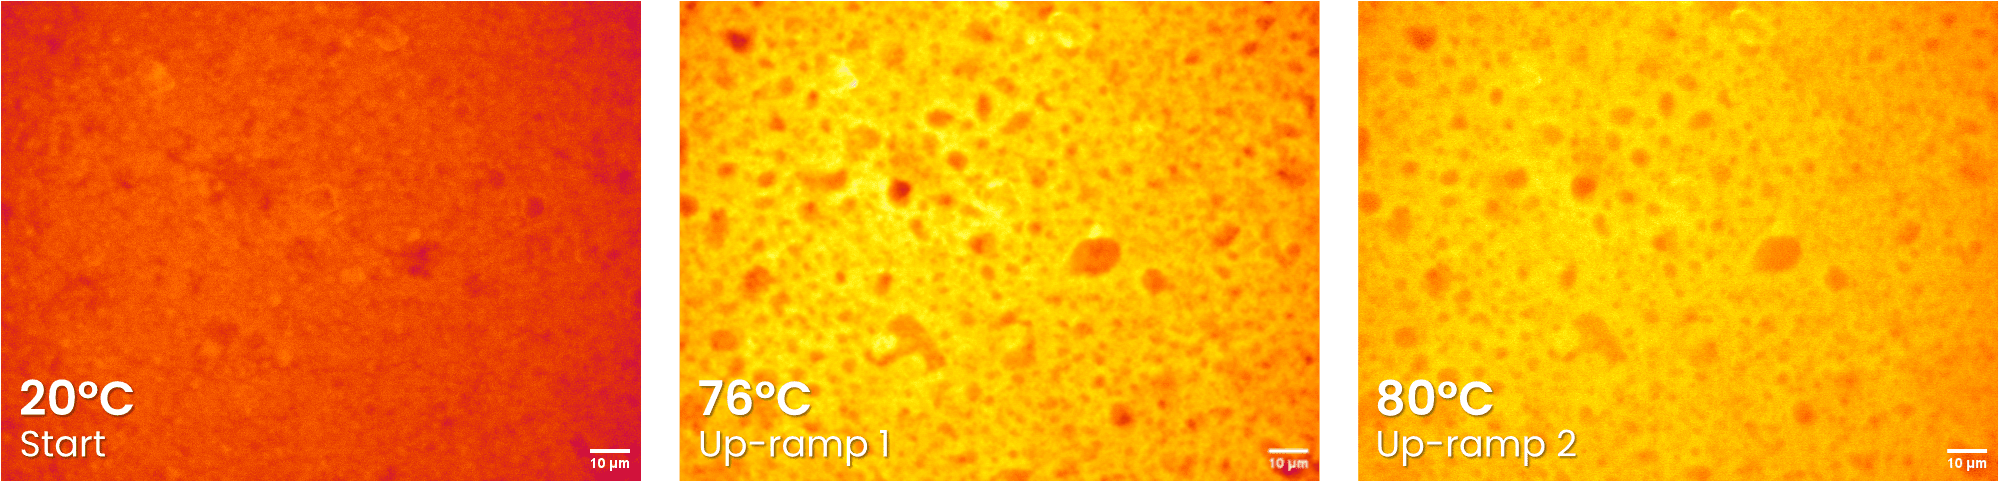
Plant-based Slice:
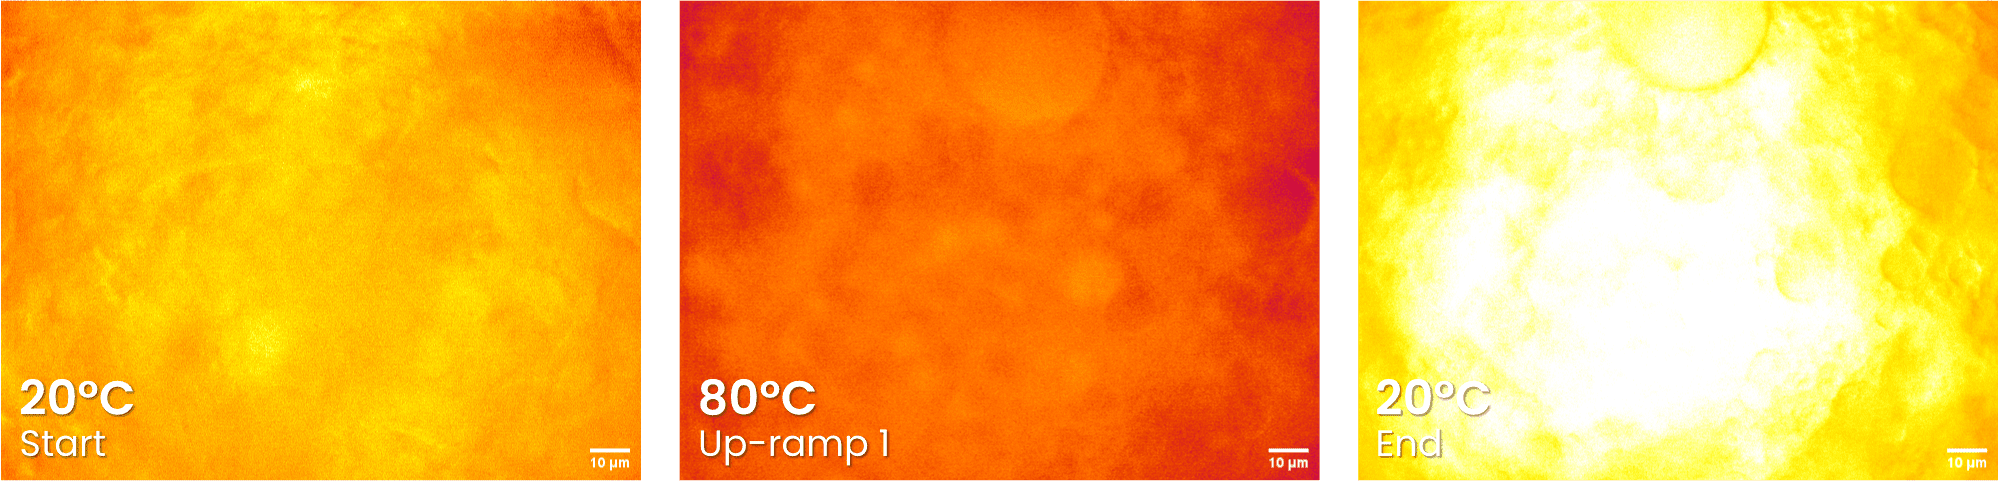
During the initial temperature increase from 20 °C to 80 °C, minimal alterations are observed in the carbohydrate structures of both D-Cheddar and V-Cheddar. Notably, the lipid structure of V-Slice does exhibit differences. The absence of imaging for D-Slice’s lipid structure complicates a direct comparison between the carbohydrate and lipid structures of D-Slice. However, drawing inference from the behaviours of D-Cheddar, V-Cheddar, and V-Slice, one could reasonably assume that the lipid structure of D-Slice would similarly undergo changes with rising temperatures.
A Comparison of All Cheese Melt Profiles
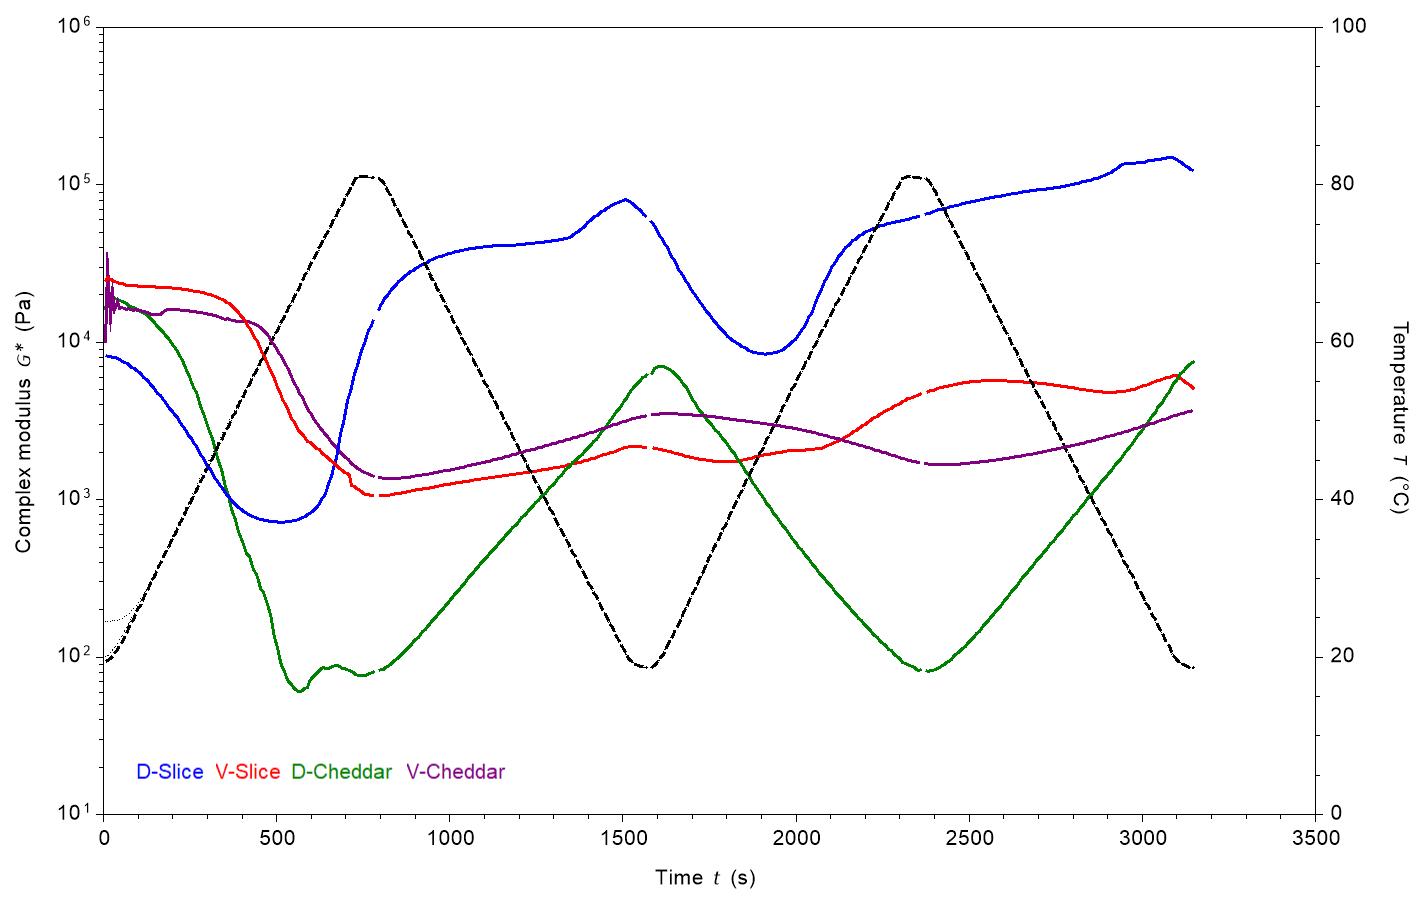
The analysis of complex modulus curves for all cheese samples reveals that vegan “cheeses” exhibit greater similarity in behaviour to each other, rather than the dairy counterparts they are designed to act as an alternative for. Whilst V-Cheddar (purple) does mimic the melting and cooling behaviour of its dairy counterpart, it does so to a much lesser extent based on the less pronounced changes in G* following the initial melt.
Among the samples, only D-Cheddar exhibits resilience to the cyclic heating and cooling process within the 20-80 °C range. In a hypothetical scenario where this cheese is utilised on a pizza, it would retain its properties well upon reheating, resembling its initial ‘cooked’ state. Conversely, D-Slice, V-Cheddar, and V-Slice undergo permanent alterations during the initial melting phase and fail to revert to their pre-heated characteristics. This observation suggests that these cheeses would not maintain desirable qualities after being melted once.
Conclusion
Rheology serves as a valuable tool for product developers, offering precise measurements and data analysis pertaining to their liquid or semi-solid products. When coupled with imaging using rheo-microscopy, developers gain valuable insights into the underlying factors influencing the behaviour of their products.
The development of plant-based cheeses presents significant challenges. Through insights into the structural and behavioural characteristics of these cheese replacements, developers can identify necessary adjustments in formulation to more closely resemble the dairy cheese they seek to emulate.
At the Centre for Industrial Rheology, we specialise in generating rheological profiles for various purposes, including formulation analysis, formulation comparison, and competitor comparison.
For further information about these tests, or the range of tests that we offer, please contact us.