The advantages of comparing astringency have been showcased by investigating the behaviour of protein-based beverages when mixed with mucin and monitoring any changes in the COF; a significant increase in COF can signify astringency due to precipitation of salivary proteins. This work will likely be of interest to those developing food products containing protein or plant-based protein, or those working within the more general foods market with an interest in identifying potential astringency differences between samples.
Contact us to arrange a lab tour and discuss comparing astringency techniques with our experts
As consumers look for increasingly varied sources of protein, usually for health or environmental benefits, manufacturers are also looking to develop innovative protein-containing products. However, the addition of protein to foodstuffs can lead to issues in terms of mouthfeel, in particular astringency.
Astringency: What is it and why does it occur?

Astringency is commonly accepted to be the dry or rough sensation experienced when eating particular foods, e.g. tea, wine or unripe fruit. When developing palatable protein-containing beverages, astringency can be a significant hurdle to overcome. Traditionally, whey proteins derived from milk dominated the protein market, but some consumers are now looking for products containing plant-based proteins, for example pea protein. However, switching one protein source for another is not simple and the astringency profiles of plant and animal-derived proteins can be significantly different, often requiring distinct formulations, possibly with significant research and development required before launch of a new product.
There are two commonly accepted models that explain the origin of astringency. The first is that astringency is a receptor-based sensation, where astringent compounds stimulate geminal or taste nerves. The other model describes astringency as a friction-based sensation, where some chemical compounds (e.g. tannins) induce precipitation of insoluble aggregates that interact with oral surfaces, increasing the friction between these oral surfaces. With the latter model, changes in coefficient of friction (COF) can indicate interaction between mucin and astringent compounds that can be detected using soft tribology.
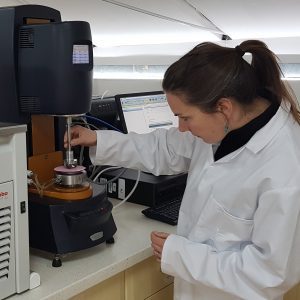
We have developed a soft-tribological technique to allow investigation into the potential astringency of a product based upon interaction with mucin.
Soft tribology to detect astringency
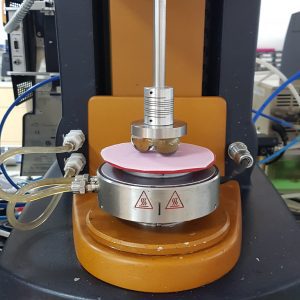
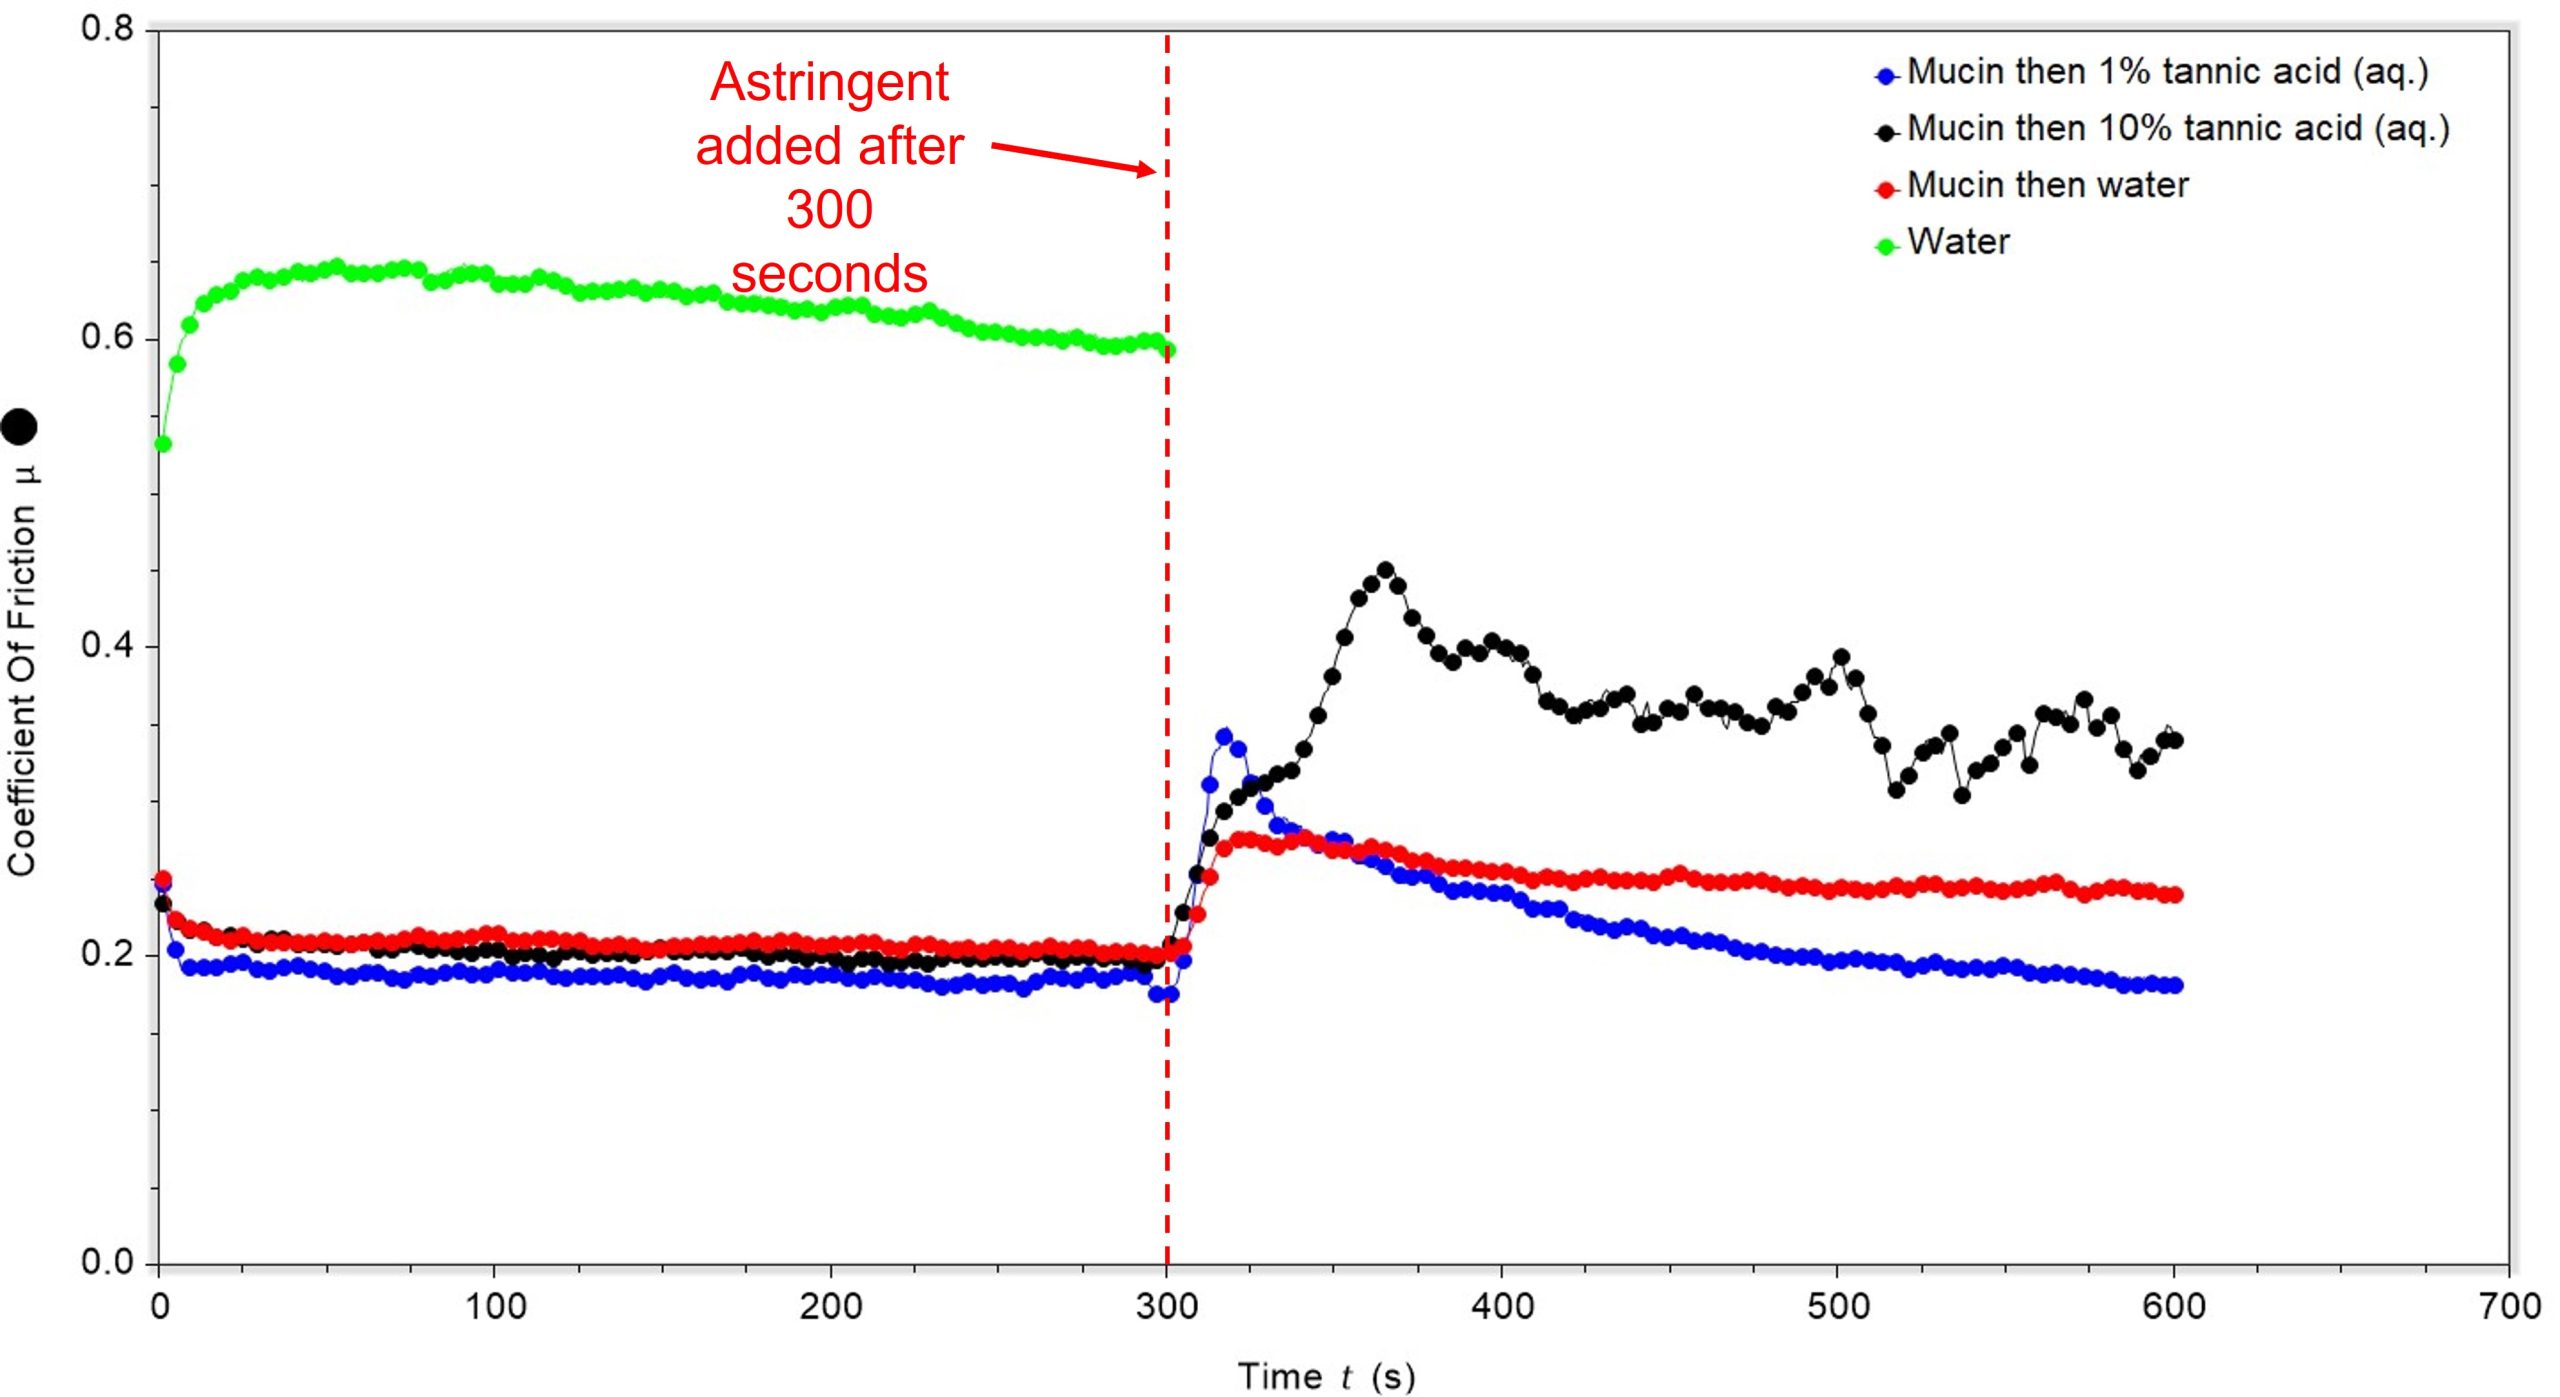
Firstly, we confirmed that astringency could be detected using our soft-tribology set-up. To this end, porcine gastric mucin, a commonly-used saliva surrogate, was subjected to continuous shear upon a PDMS surface at a set rate with set axial pressure for 300 seconds. After this time, an aqueous solution of known astringent was added, to give a 1:1 ratio overall, and the change in coefficient of friction monitored, Figure 1. An increase in coefficient of friction was taken to indicate astringency, which was tentatively attributed to precipitation of proteins from the mucin. A decrease in coefficient of friction was taken to indicate increased lubricity. In both cases, a change in coefficient of friction was believed to indicate interaction between mucin and the sample.
The coefficient of friction of water was approximately 0.6 under these particular reaction conditions, giving a base-line reading for any contribution of water in aqueous media in this system. In all cases, the coefficient of mucin was constant for the first 300 seconds with a value of approximately 0.2 under these conditions, Figure 1. This shows that changes between aqueous media and mucin can be detected.
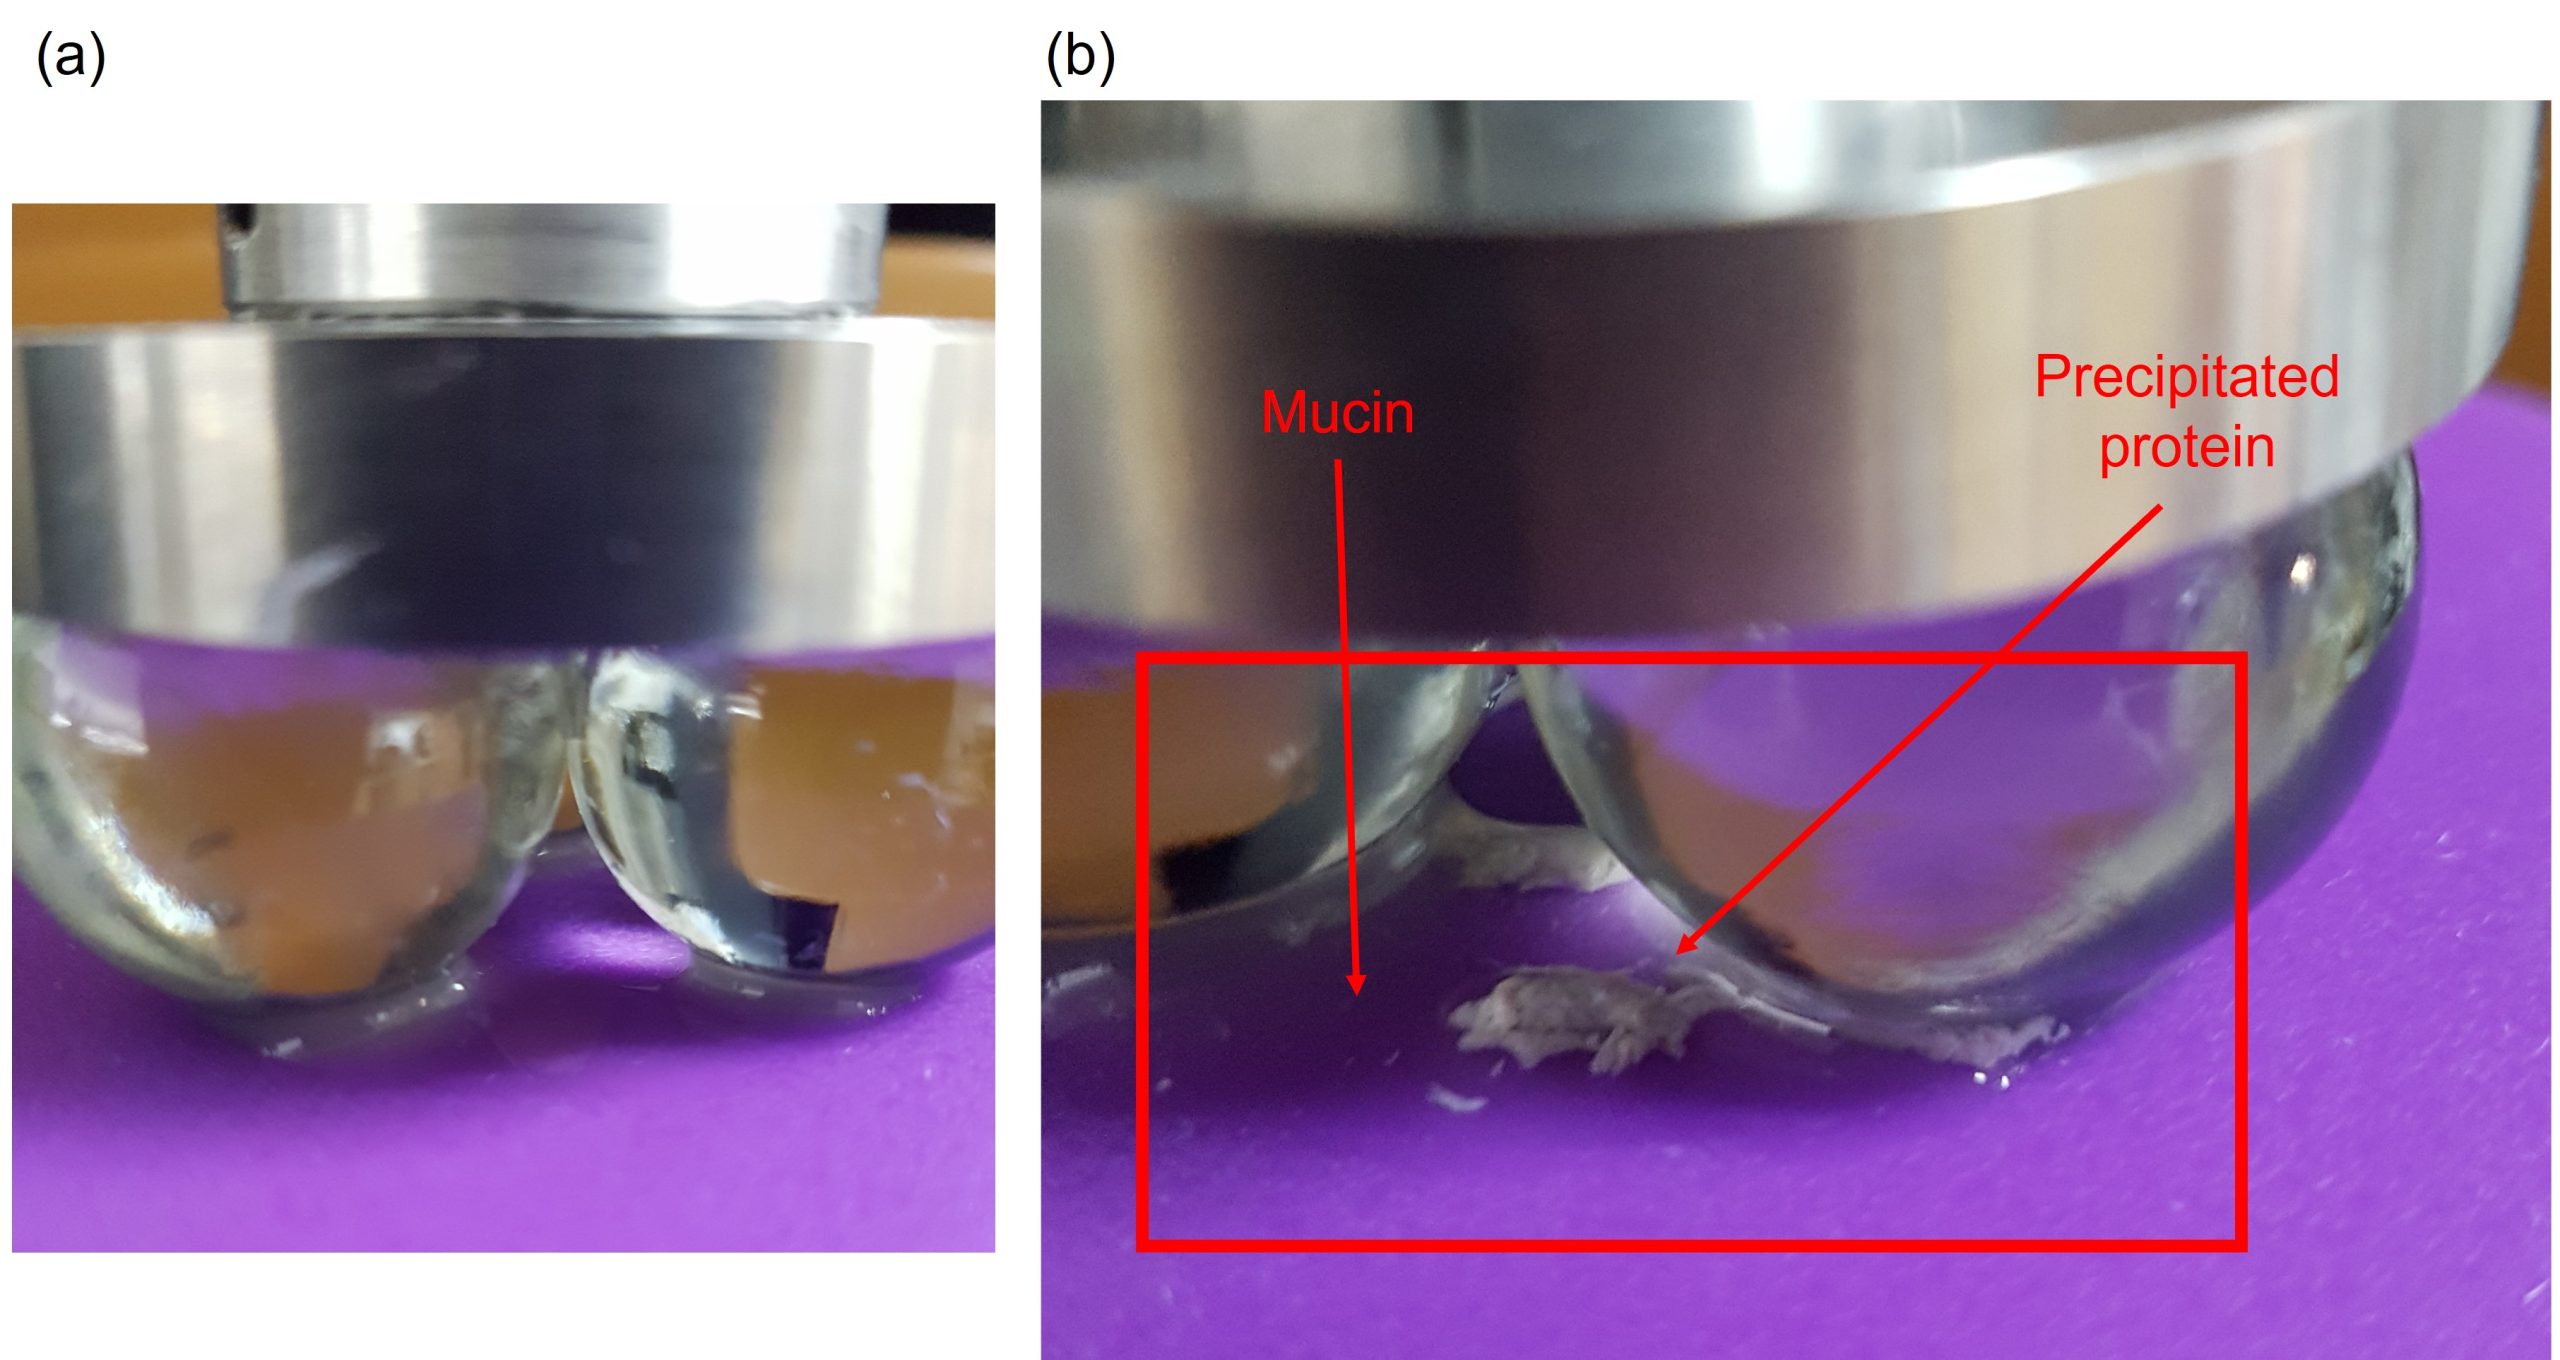
After 300 seconds, the addition of either water or an aqueous tannic acid solution induced a change in the COF. Addition of 1% tannic acid (aq.) led to an initial increase in coefficient of friction, which then decreased over the experiment. This was tentatively attributed to initial precipitation of proteins that were then coated in mucin leading to a decrease in friction. The second experiment involved addition of 10% tannic acid (aq.). This again led to an increase in coefficient of friction, but in this case it was maintained. Visually, addition of 10% tannic acid (aq.) to the mucin led to a significant transformation; the mucin changed appearance from a colourless solution to containing globules of precipitated protein, Figure 2. The final experiment was to determine the extent to which water impacts upon the lubrication. As noted earlier, water has a higher COF than mucin. Addition of water to mucin did lead to an increase in COF that was maintained, but not to the same extent as water without any additives, suggesting that mucin tempers the impact of water.
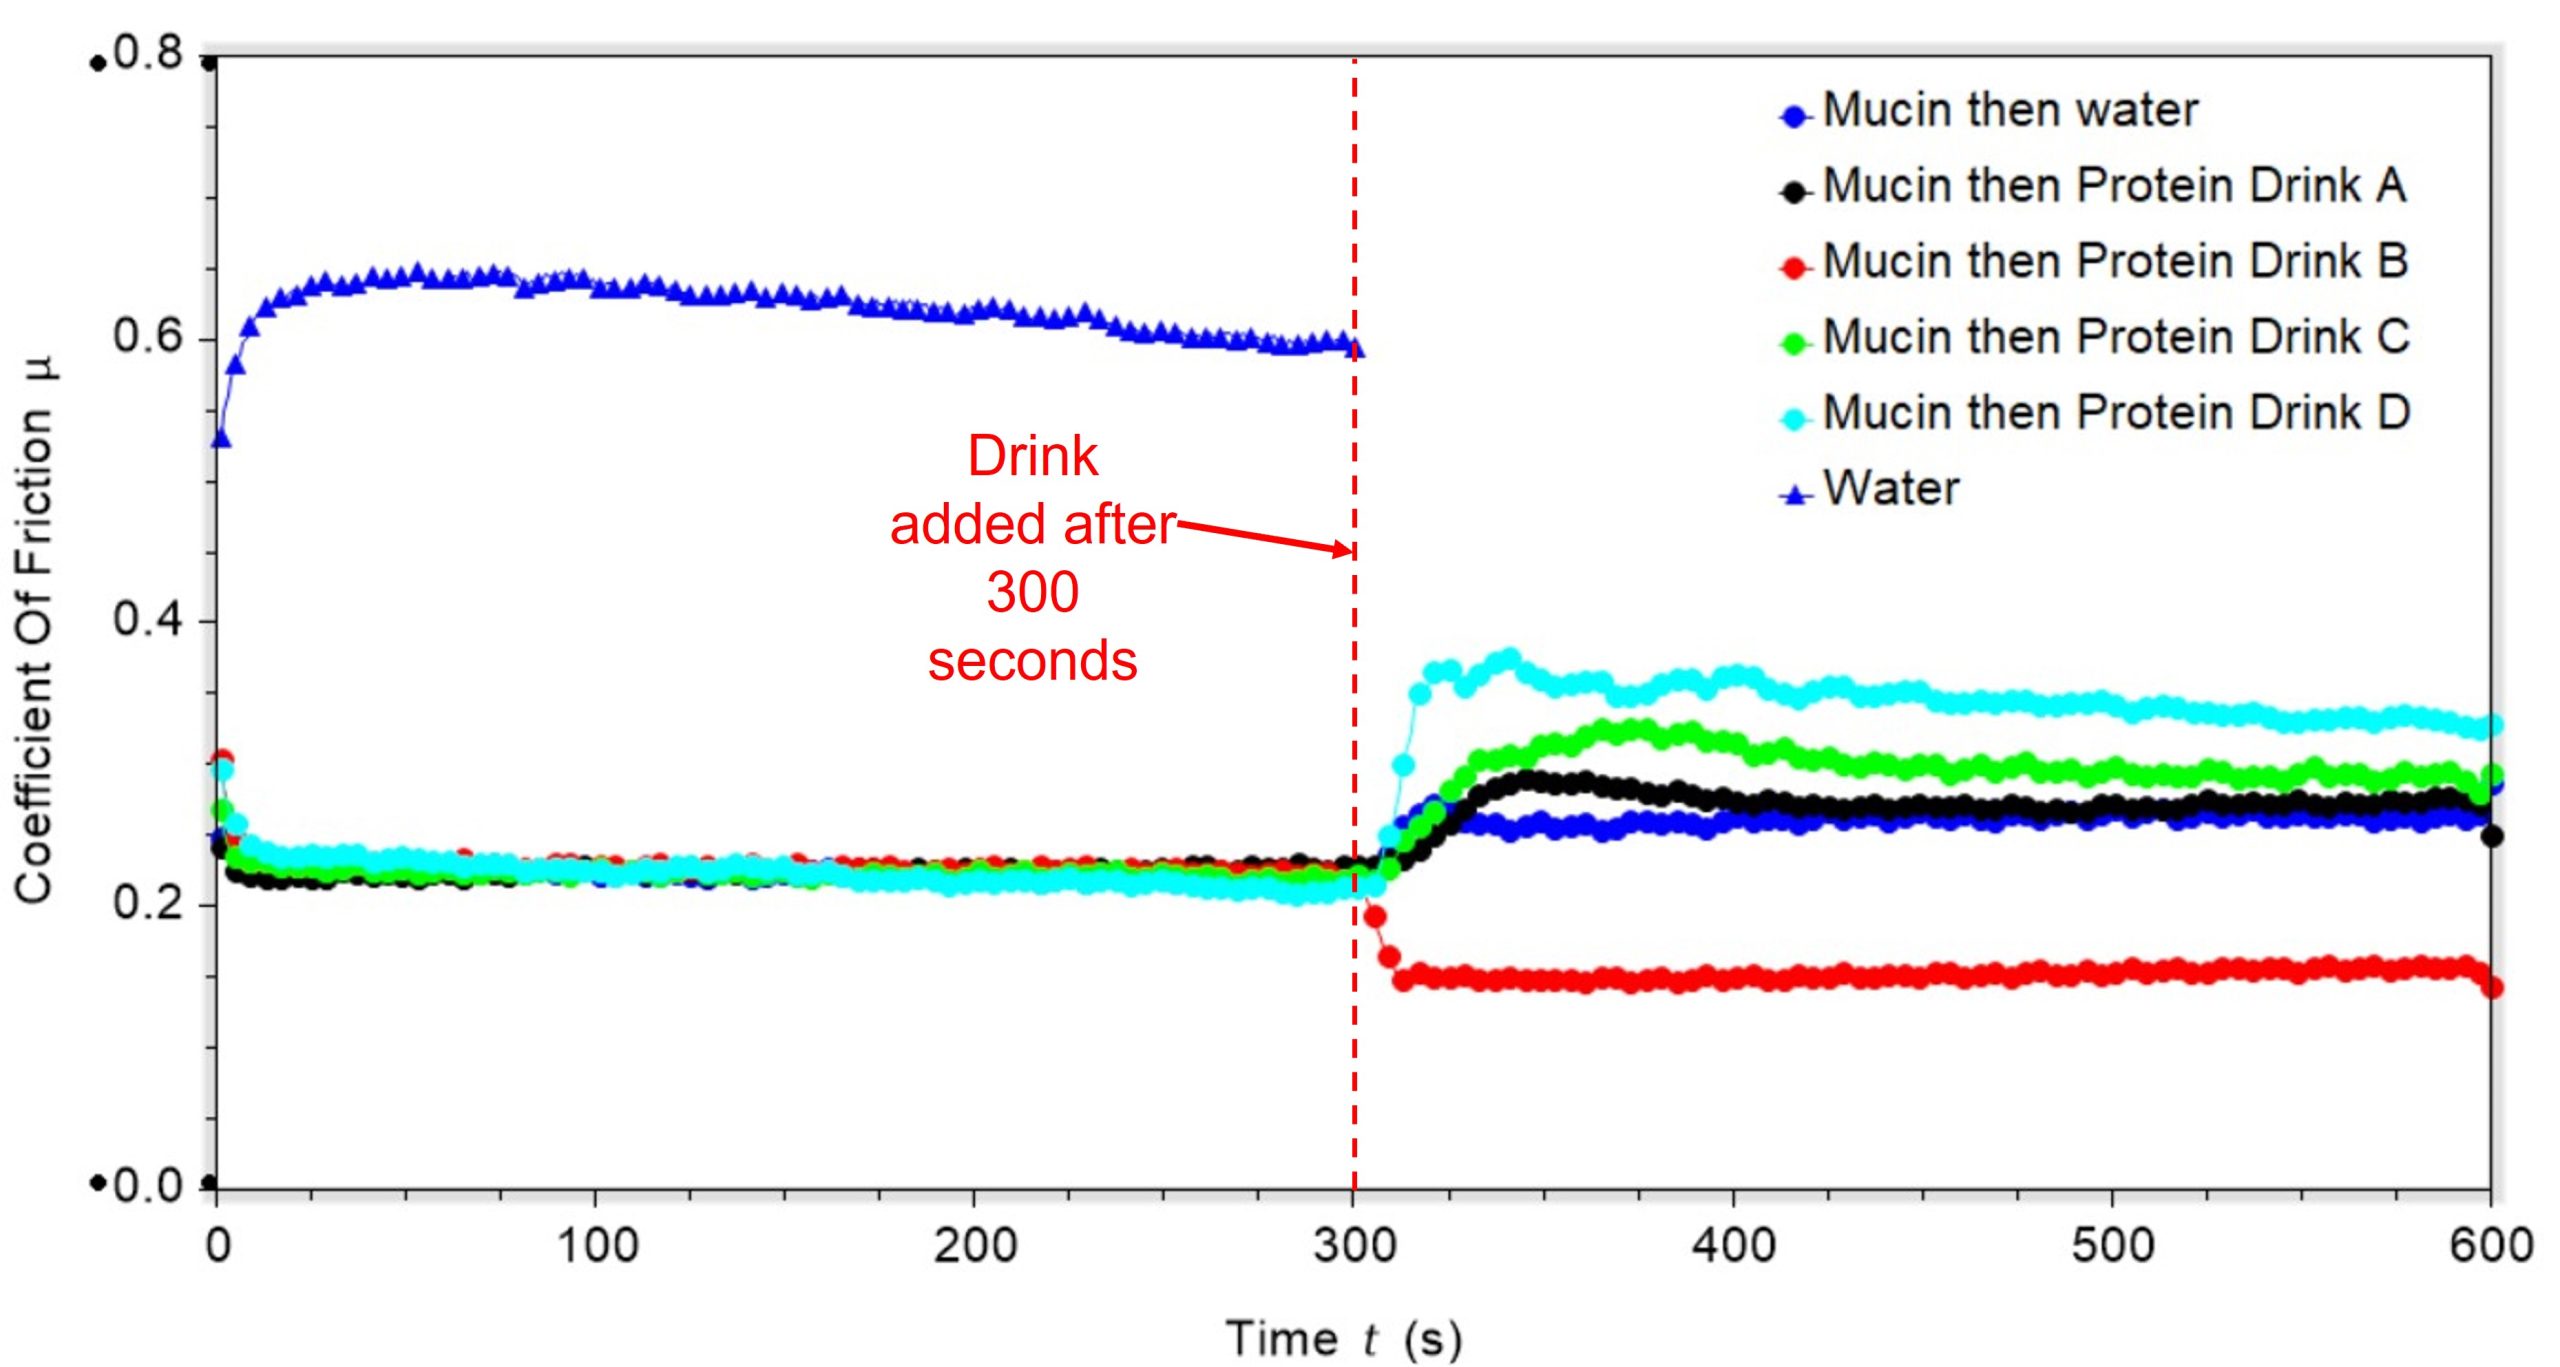
The second stage was to determine if there was a change in COF when protein-containing drinks were added to the mucin sample. Again, COF data for water were collected as a comparison. In all cases, a change in COF was seen upon addition of protein drink to the mucin, Figure 3. Addition of water led to a slight increase in COF, which was virtually identical to that seen upon addition of Protein Drink A. Interestingly, addition of Protein Drink B led to a decrease in COF, suggesting that Protein Drink B induced lubrication upon interaction with mucin. Both Protein Drinks C and D resulted in an increase in COF, with Protein Drink D showing the largest change. This increase in COF was tentatively attributed to precipitation of salivary proteins, which are widely regarded to be a contributing factor to astringency.
This study has given valuable insight into the behaviour of protein drinks when interacting with a mucin surrogate. In addition, the use of a single sliding speed throughout the experiment gives a rapid visual indication of any changes allowing direct comparison between different samples. This work will be of interest to those involved in developing alt-protein food products, or those working within the more general foods market with an interest in astringency differences between samples.
For further information about these tests, or the range of tests that we offer, please contact our experts today