Dynamic foam analysis can provide insight into foaming behaviour during the foam generation process and once the foam has been formed. Key parameters such as foam height, bubble size and mean bubble area can be readily determined. Comparing and contrasting these values between samples can allow for benchmarking and product comparison. This case study investigates the differences between aquafaba and egg white derived foams when they are generated by whisking.
Contact us to arrange a lab tour and discuss rheological techniques with our experts
Dynamic foam analysis: identifying differences between vegan and non-vegan foams
In recent years there has been an explosion of interest in dairy free, or vegan, products. In some cases, the properties of the dairy-free product are significantly different to the dairy-based original. Understanding and quantifying these properties can provide valuable insights into product behaviour from a consumer perspective, and also feed into manufacturing and R&D processes.
 We recently completed a study where we compared the rheological properties of aquafaba and egg white foams. During this study, the foams’ yield stress and linear viscoelastic (LVE) behaviour were probed. It was shown that egg white foam was stronger than aquafaba foam as the yield stress was higher i.e. more stress needed to be applied to induce an irreversible change to the structure. In addition, it was shown that both aquafaba and egg white foams were elastic dominant.
Although these findings were interesting and provided information relating to the bulk structure and physical handling properties of the foam, the bubble sub-structure and stability of the foam in relation to height and longevity could not be accurately determined. However, studying foaming behaviour using dynamic foam analysis would allow these additional properties to be probed and ultimately give two contrasting techniques for foam analysis.
In this case-study, we used dynamic foam analysis to compare the longevity and sub-structural behaviour of aquafaba and egg white foams.
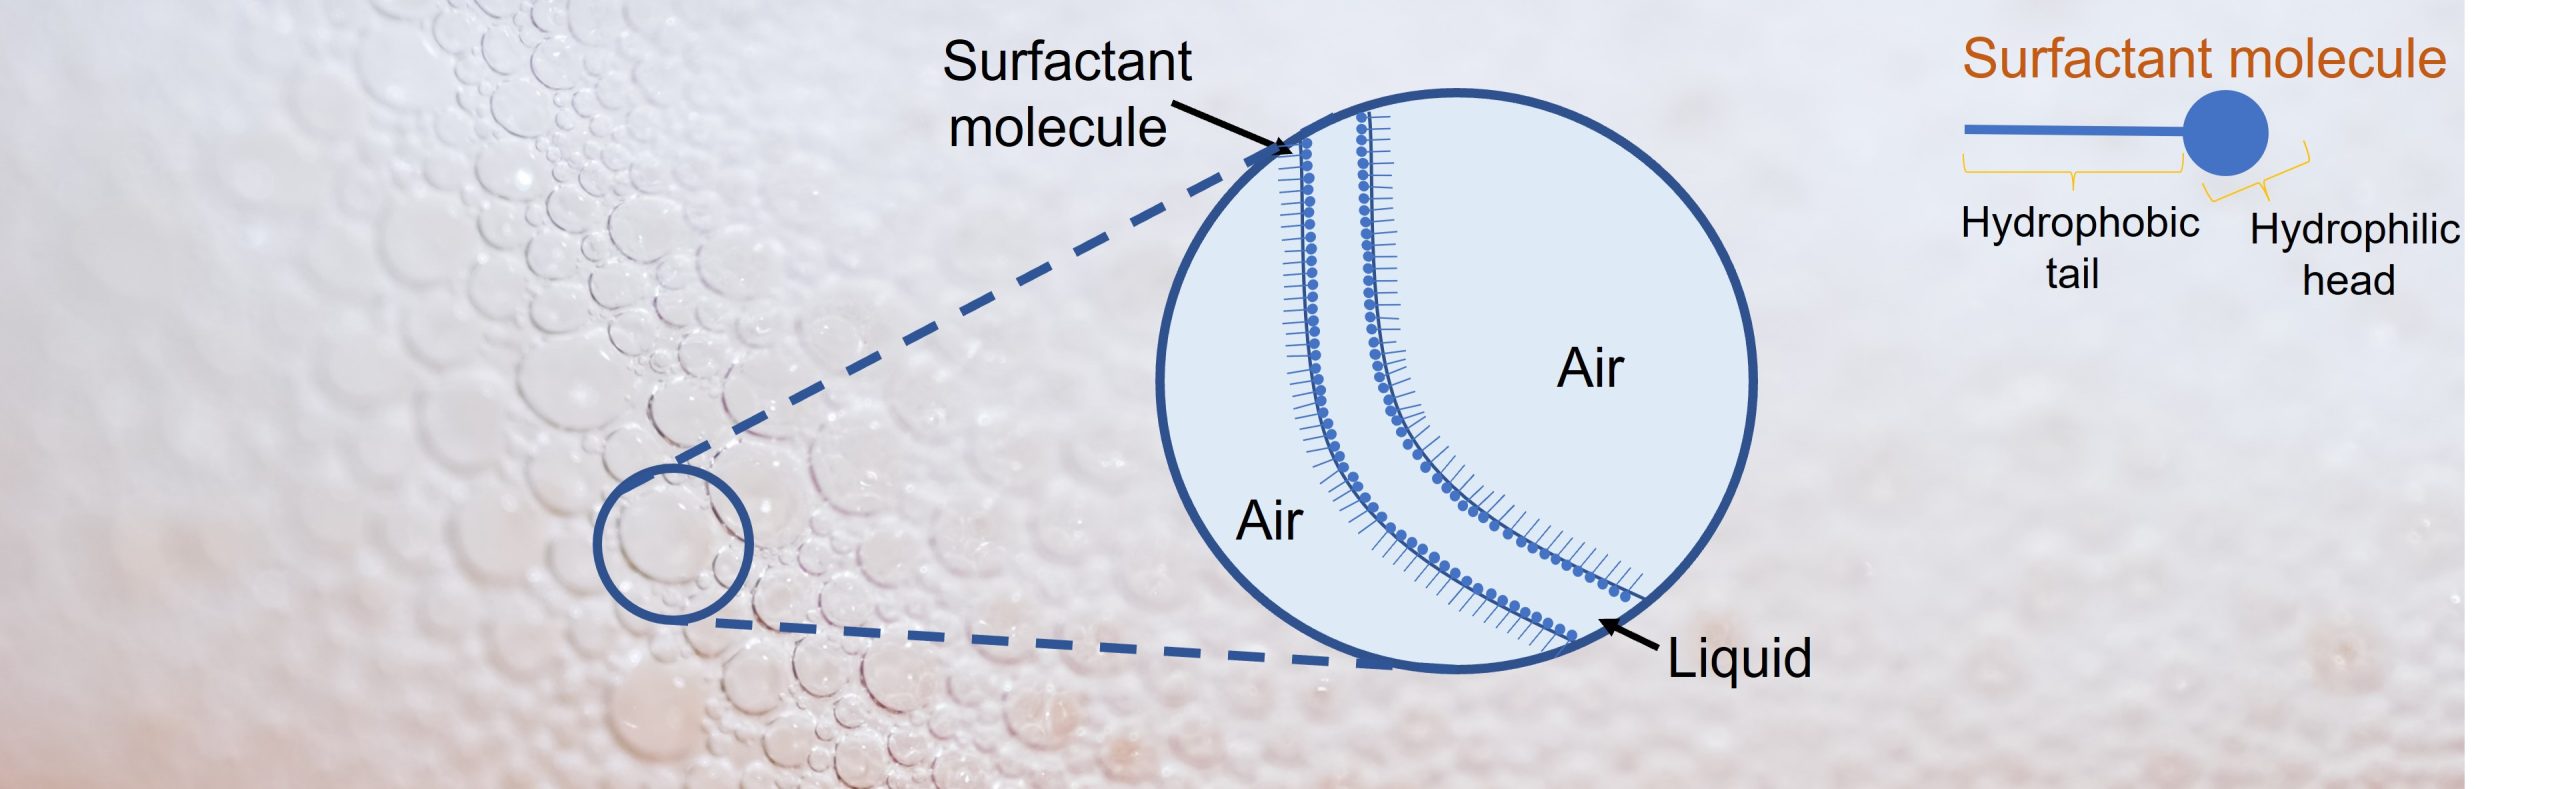
Aquafaba is a commonly-used vegan alternative to eggs with emulsifying, binding, gelatinising and thickening properties. It is particularly useful for generating foams, for example within products such as meringues and marshmallows. The foaming properties are due to the presence of emulsifiers such as polysaccharides and saponins, as well as proteins such as albumins and globulins. These materials form layers at the interface between the aqueous phase and air, stabilising any air pockets generated. Any hydrophilic functionality resides in the aqueous phase and hydrophobic functionality in the air pocket. This means that these emulsifiers can surround the air bubble and stabilise it within the coating liquid, preventing air bubbles from agglomerating and rising to the surface to escape.
Comparing aquafaba and egg white foam
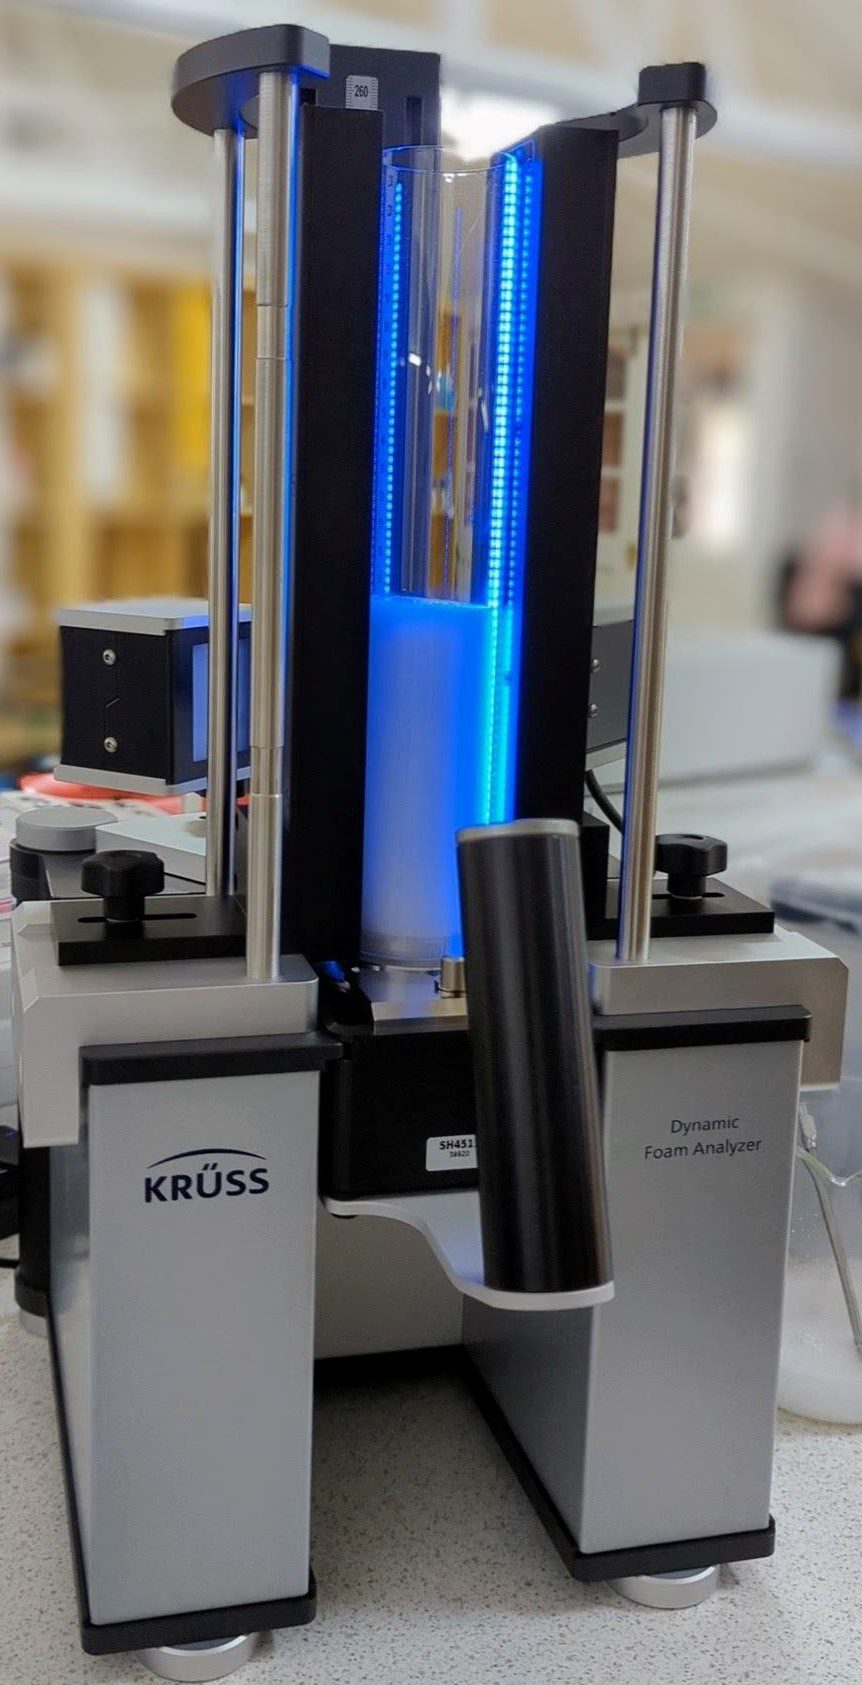
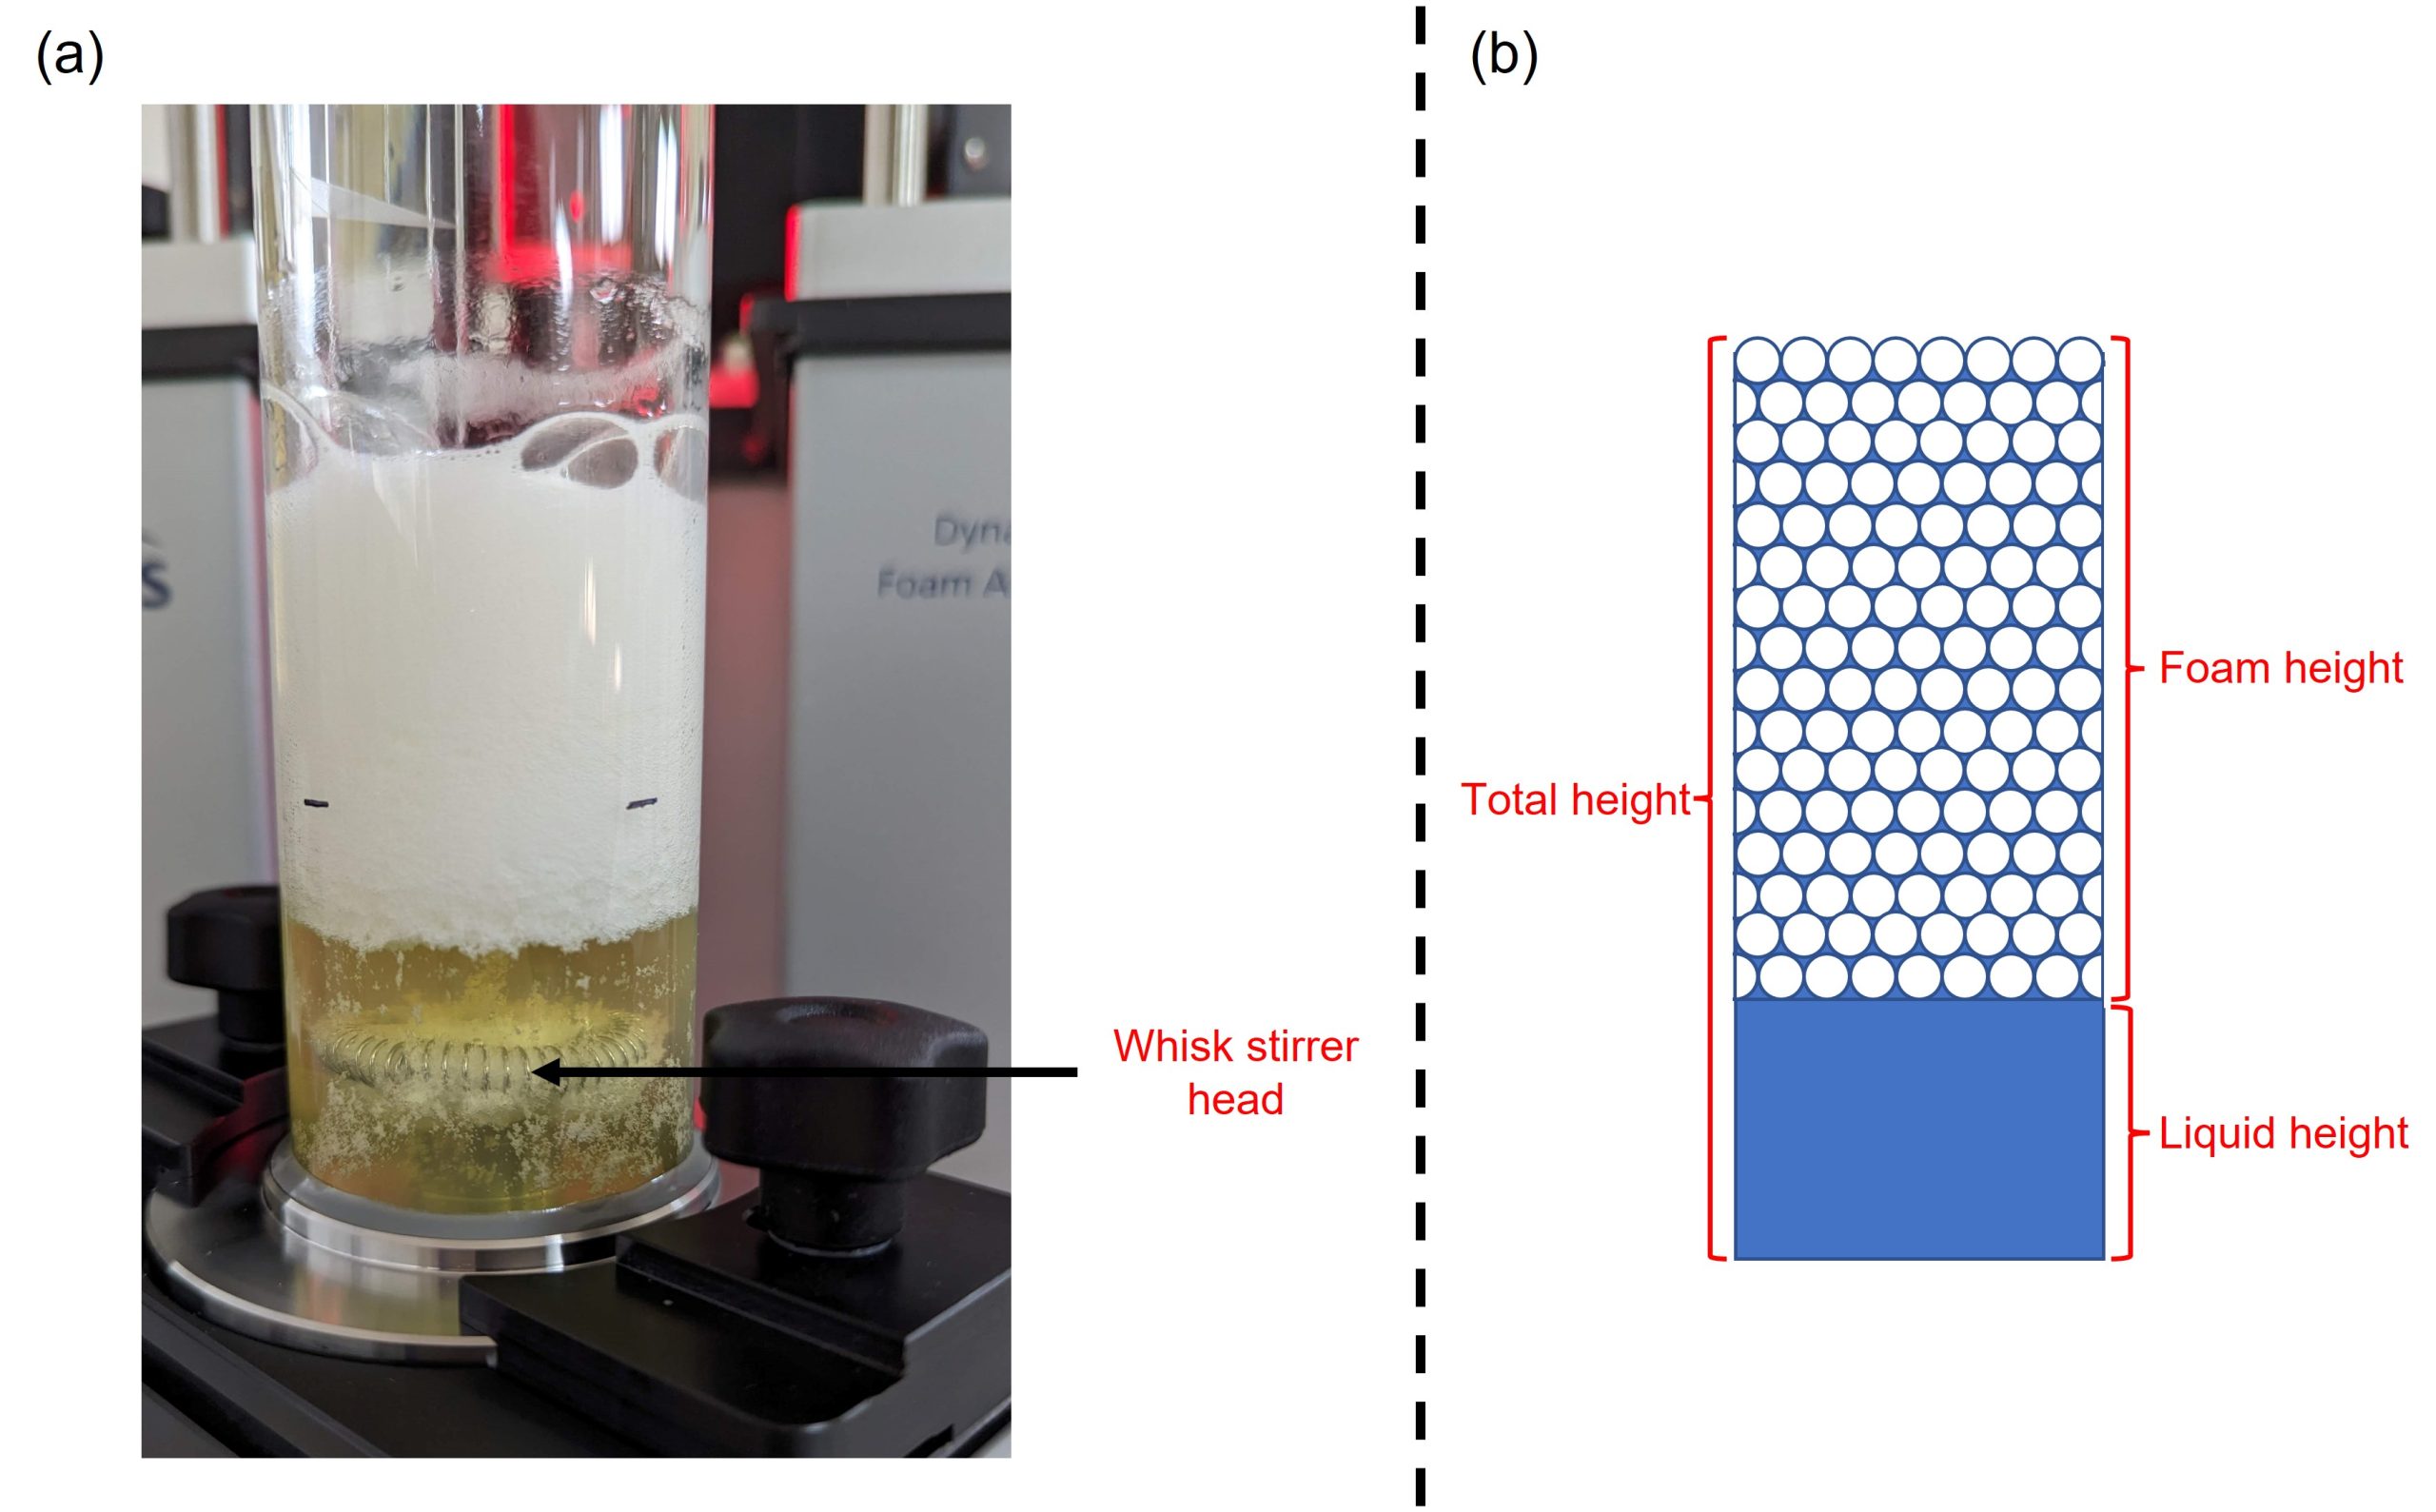
In this study, the foaming characteristics of egg white and chickpea water (aquafaba) were investigated. For each experiment, egg white or aquafaba (50 mL) was added to the Krüss Dynamic Foam Analyser (DFA100) and the liquid whisked with the whisk stirrer head at 4000 rpm for 120 seconds, Figure 1(a).
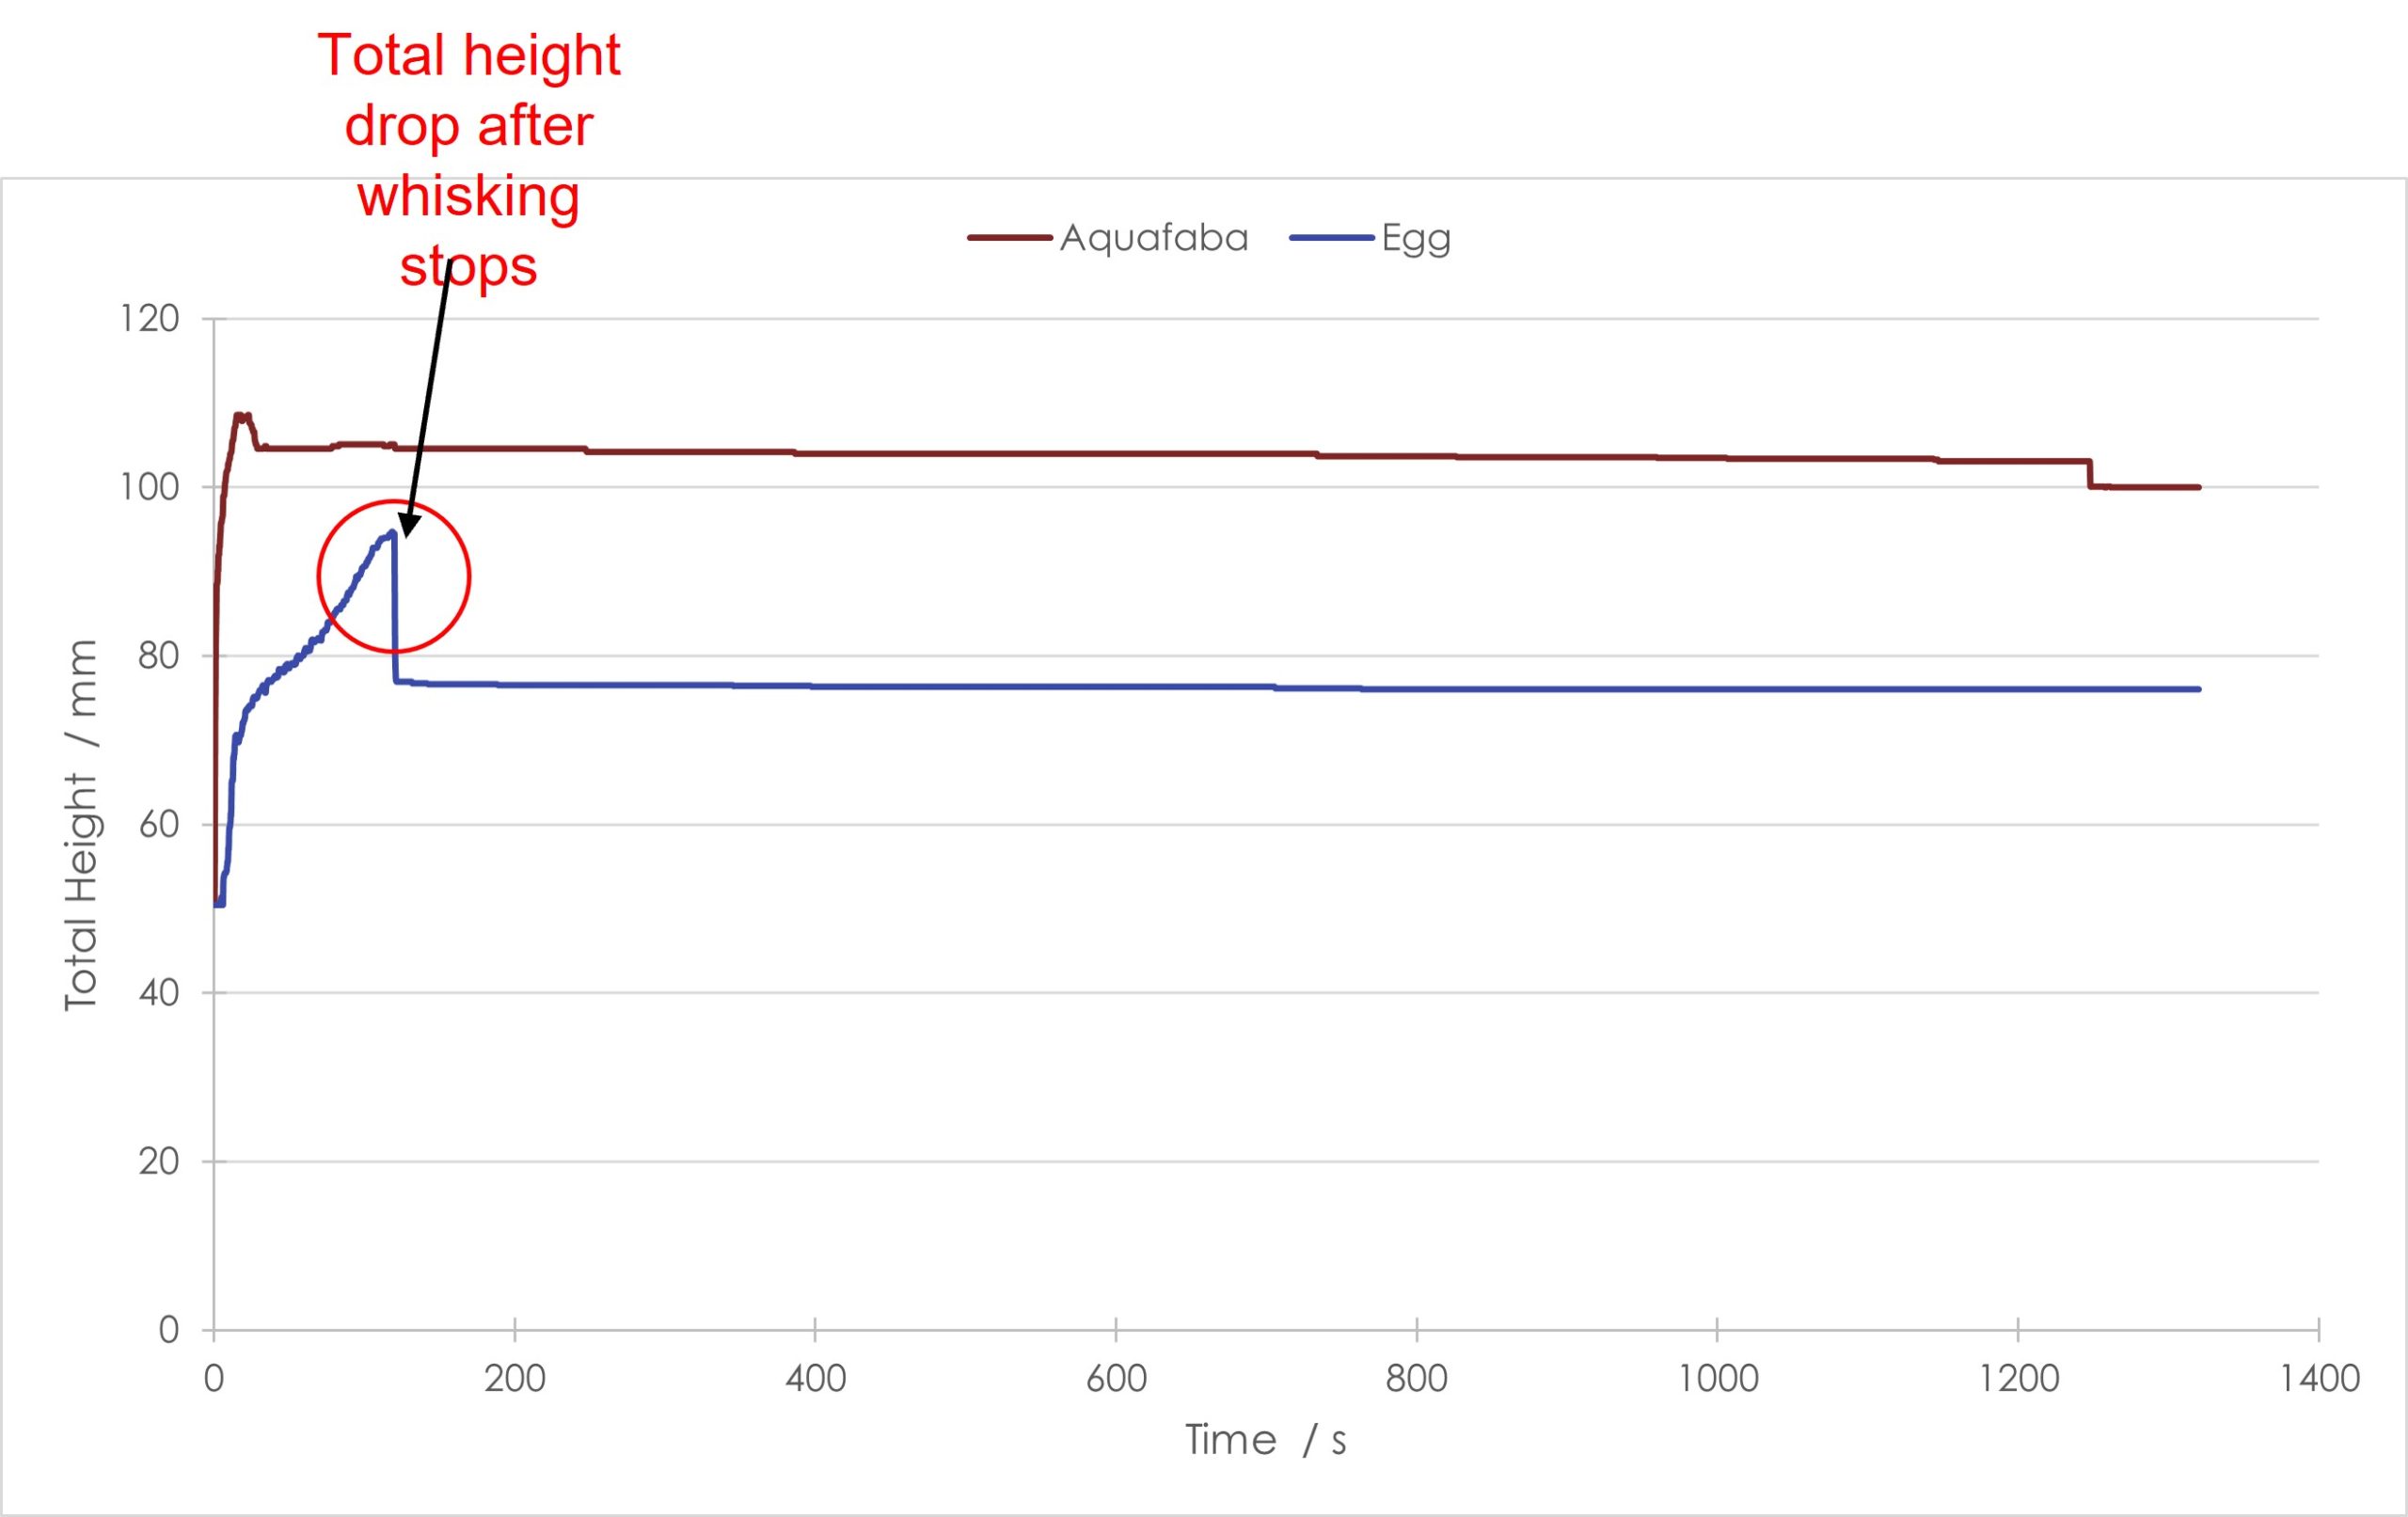
Comparing the total height data (where both foam and liquid phase heights are taken into account), it can be seen that the aquafaba foam forms a structure that is taller than that of the egg white foam. The metric for ‘total height’ had to be used with these samples as the aquafaba liquid was too opaque to accurately measure the interface between the liquid and foam layers, therefore foam height and liquid height could not be accurately determined, Figure 1(b).
Comparing foam height
These data clearly show that for egg foam, once whisking was stopped the total height dropped significantly, Figure 2. The same was not observed for aquafaba. The height drop was attributed to the vortex that was formed during whisking. This was extremely pronounced when forming egg white foam, and artificially increased the foam height during the whisking phase. When whisking stopped (and the vortex therefore stopped) the drop in the foam height was significant.
When considering total height, the egg white foam is arguably more stable than the aquafaba foam. This can be seen by the plot of total height for egg white foam remaining constant over the experiment, whereas the aquafaba foam height decreased slightly. In addition, at approximately 1200 seconds there is a drop in aquafaba foam height. This was due to foam collapse at the top of the foam column.
Bubble count and mean bubble area data
Looking at the bubble count and mean bubble area also revealed differences between the two samples.
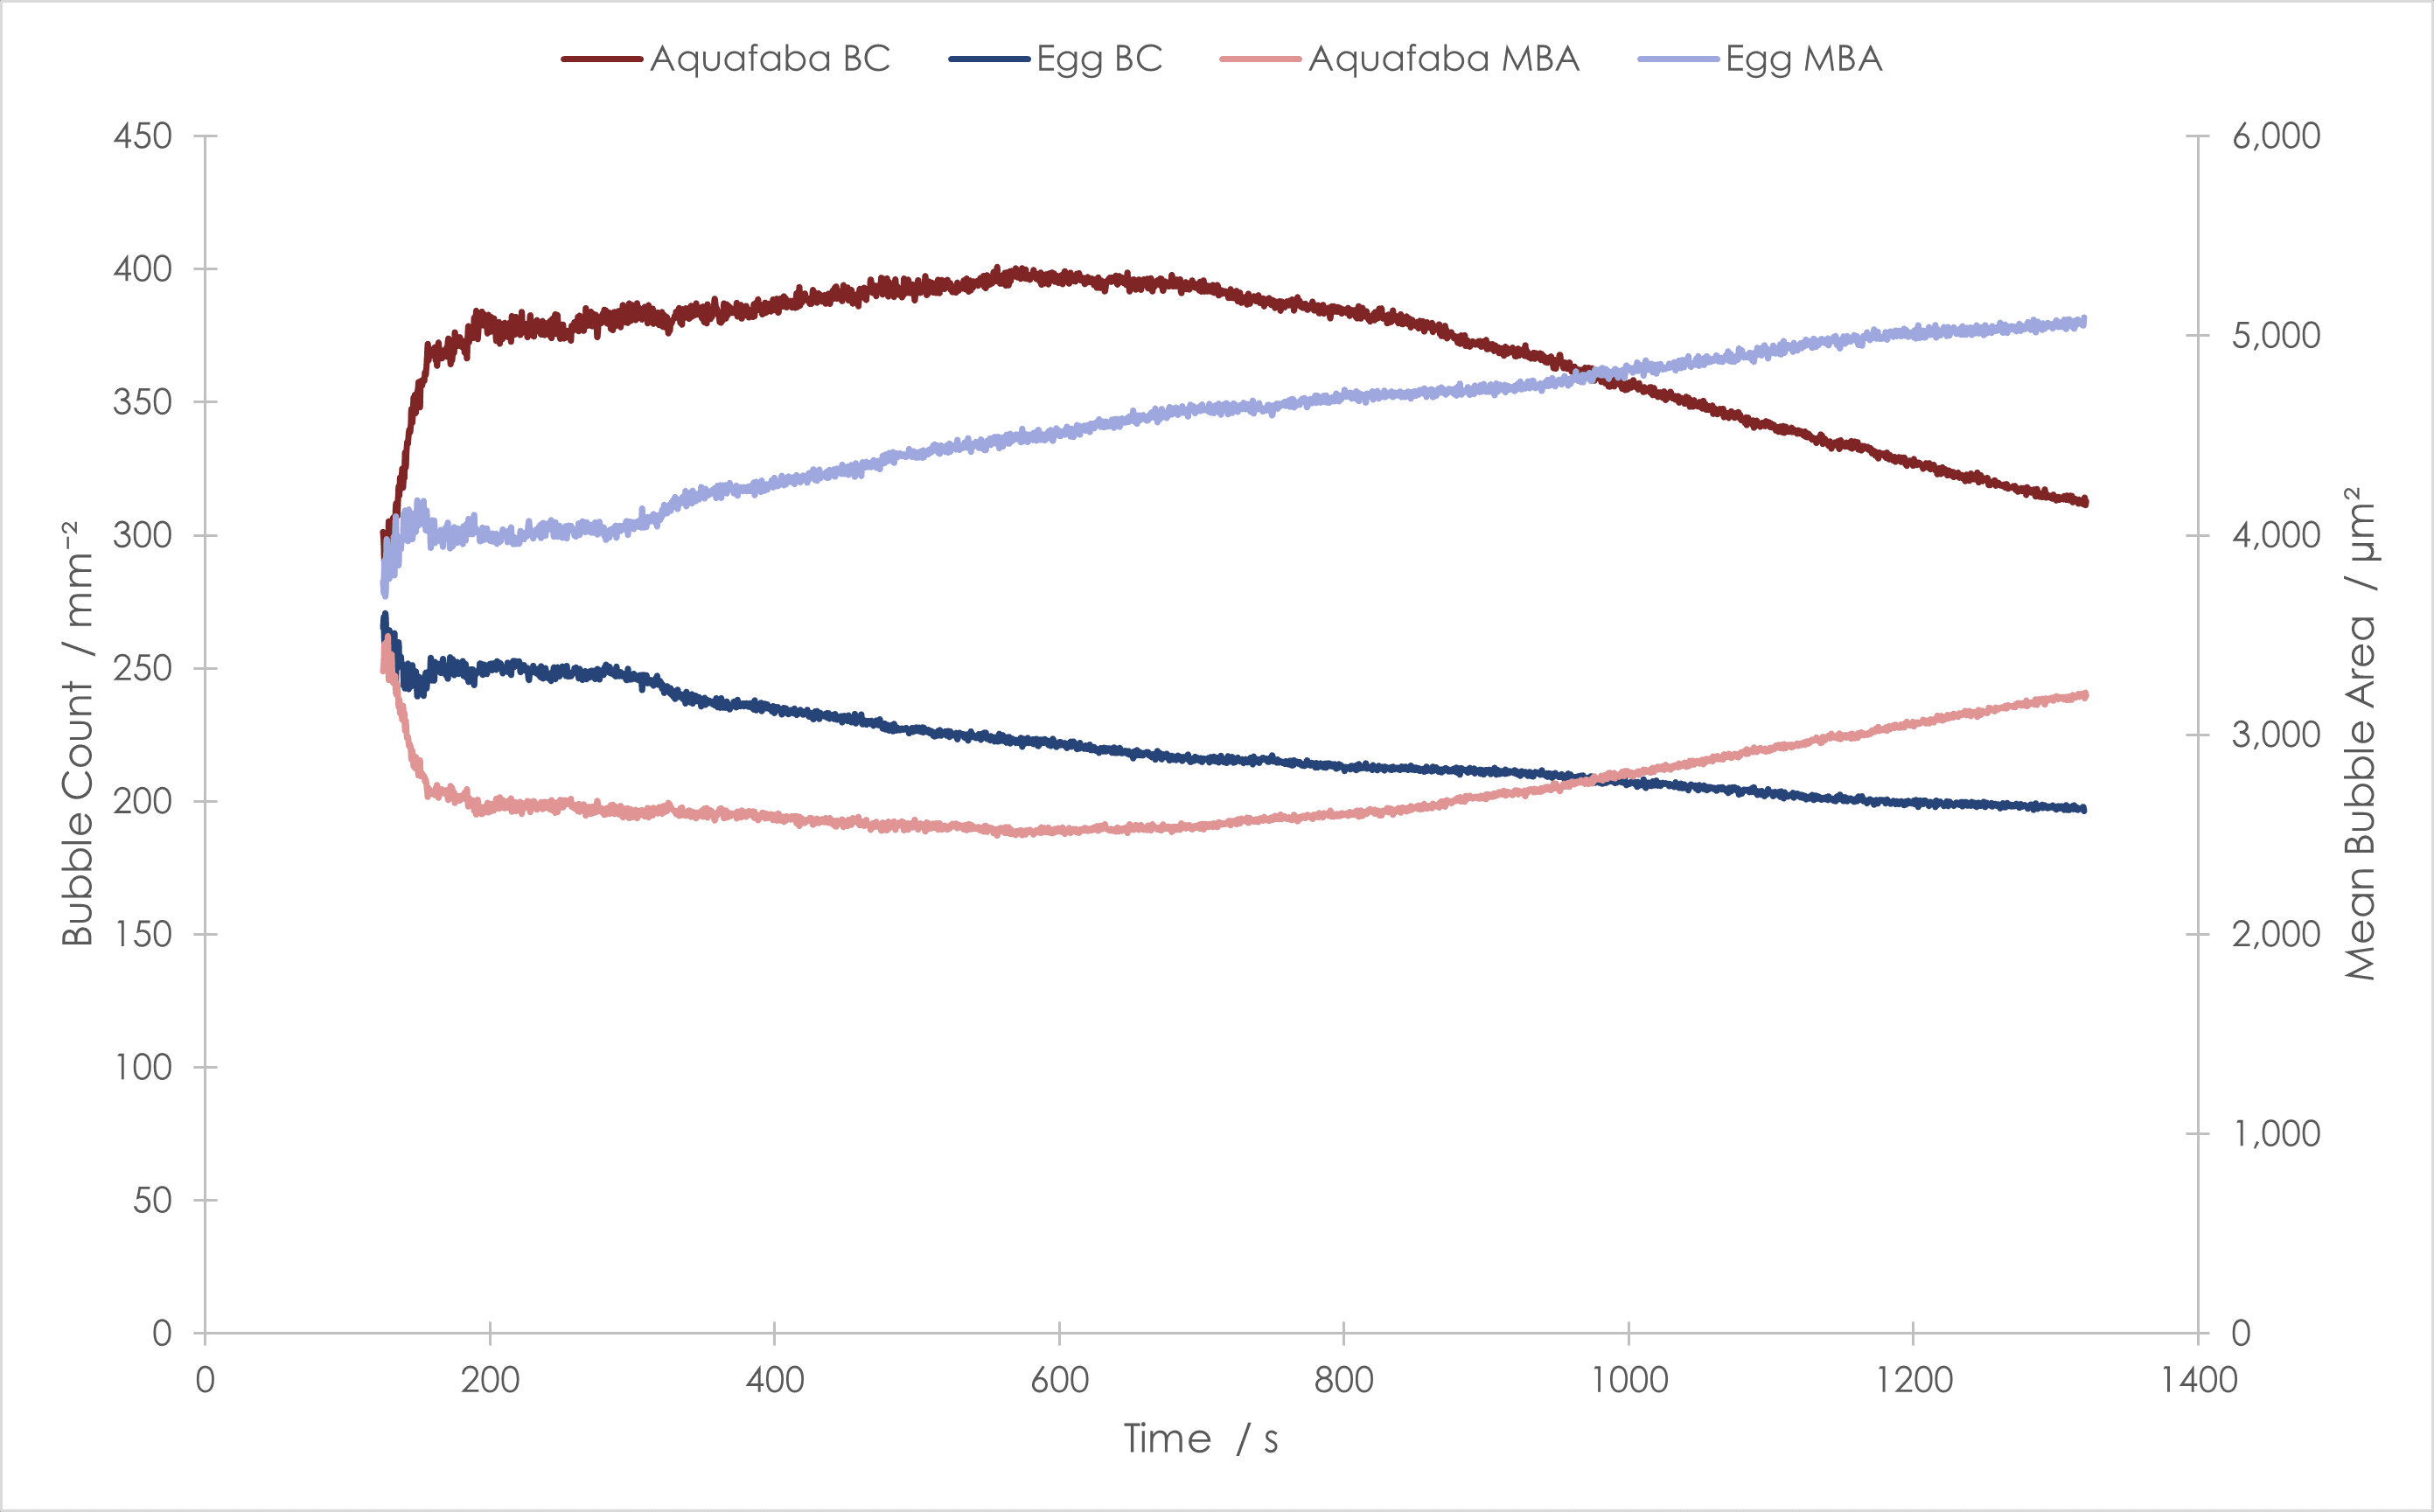
Aquafaba foam had a higher bubble count per unit area than egg white. In addition, the bubble count for aquafaba stayed fairly constant for ~600 seconds and then the foam started to decay. Once the aquafaba started to decay, the rate of decay (as indicated by the slope of the plot) was faster than that for egg white foam. In contrast, the bubble count for egg white foam showed that from the start of the experiment the number of bubbles per unit area decreased but the rate of decay was constant.
Looking at the mean bubble area, the aquafaba had a constant value for ~600 seconds and then the mean bubble area started to increase, Figure 3. Conversely, the mean bubble area for the egg white foam started to increase from the beginning of the experiment. The rate of increase of aquafaba foam was faster than that for egg white foam. This is directly in-line with what we would expect; as the bubble count starts to decrease, the mean bubble area increases. This is because one mechanism of foam aging is coalescence, where bubbles merge into each other and each bubble increases in size.
However, when taken in combination with the total height data, the increase in mean bubble area and decrease in bubble count did not have an impact upon the total height. This therefore shows that as the foams aged the bubbles became larger, although for aquafaba foam there was a delay in this becoming evident, but the overall height of the foam was not impacted.
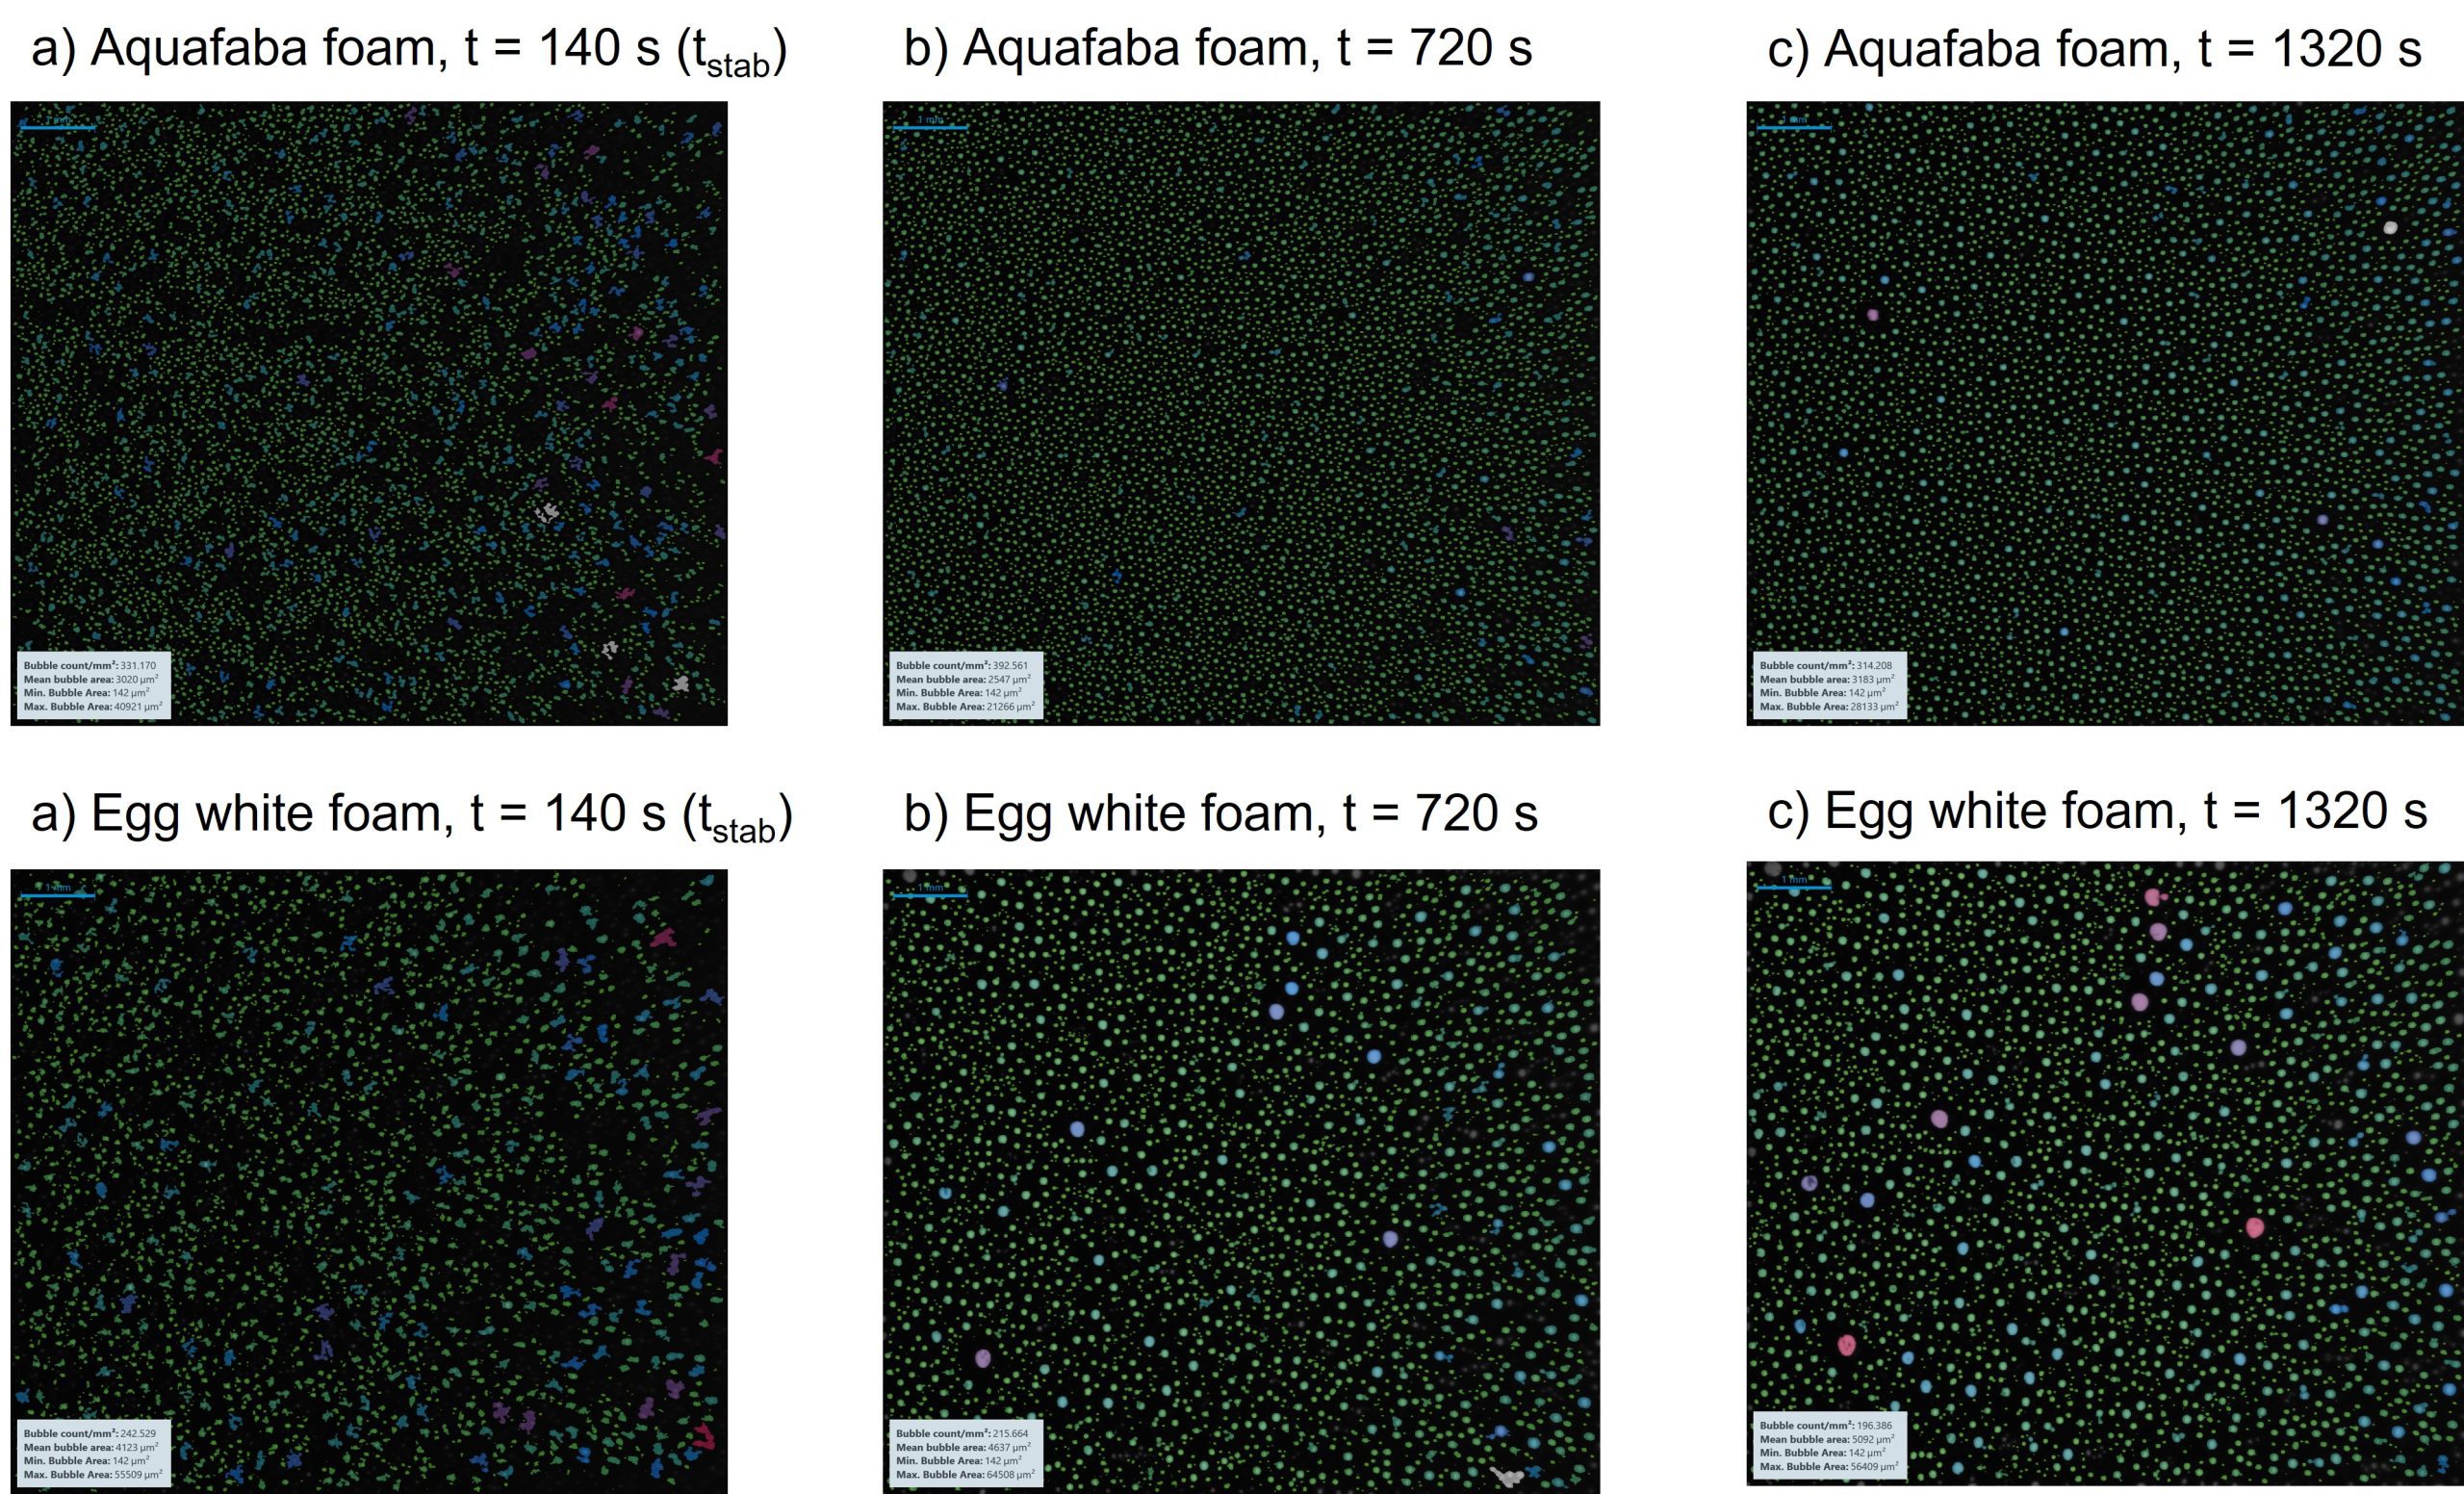
Images showing the differences in bubble size are also useful, as they provide an additional quick visual means for monitoring foam aging. False colour can also be added to emphasise differences in bubble size, Figure 4.
Comparing the bubble sizes after 140 seconds (tstab), 720 seconds and 1320 seconds reveals clear differences between the egg white foam and aquafaba foam. Tstab is defined as the ‘time of stability’, and is when dynamic motion (i.e. whisking) no longer has an effect on the foam structure and the foam is effectively static. In this case it is at 140 seconds, which is 20 seconds after whisking stopped (which took 120 seconds). As noted from the plot, Figure 3, the aquafaba foam contains more bubbles per unit area across the experiment whereas the egg white foam has larger bubbles. This is clearly visible.
Summary
In summary, dynamic foam analysis has provided interesting additional insight into the aging behaviour of foams compared with rheology alone. Key findings are:
- Egg white foam is more stable than aquafaba foam in terms of total height (i.e. liquid phase and foam phase).
- Aquafaba foam maintains bubble count and bubble mean area for longer, suggesting that the bubbles themselves are more stable. However, once the bubbles start to coalesce the rate of coalescence is more rapid than for egg white foam.
- Dynamic foam analysis combined with rheology can provide information in relation to the bulk structure and physical handling properties of the foams, as well as the structural rigidity and the material sub-structure.
For further information about this testing, and other testing regimes that we offer, please get in touch!