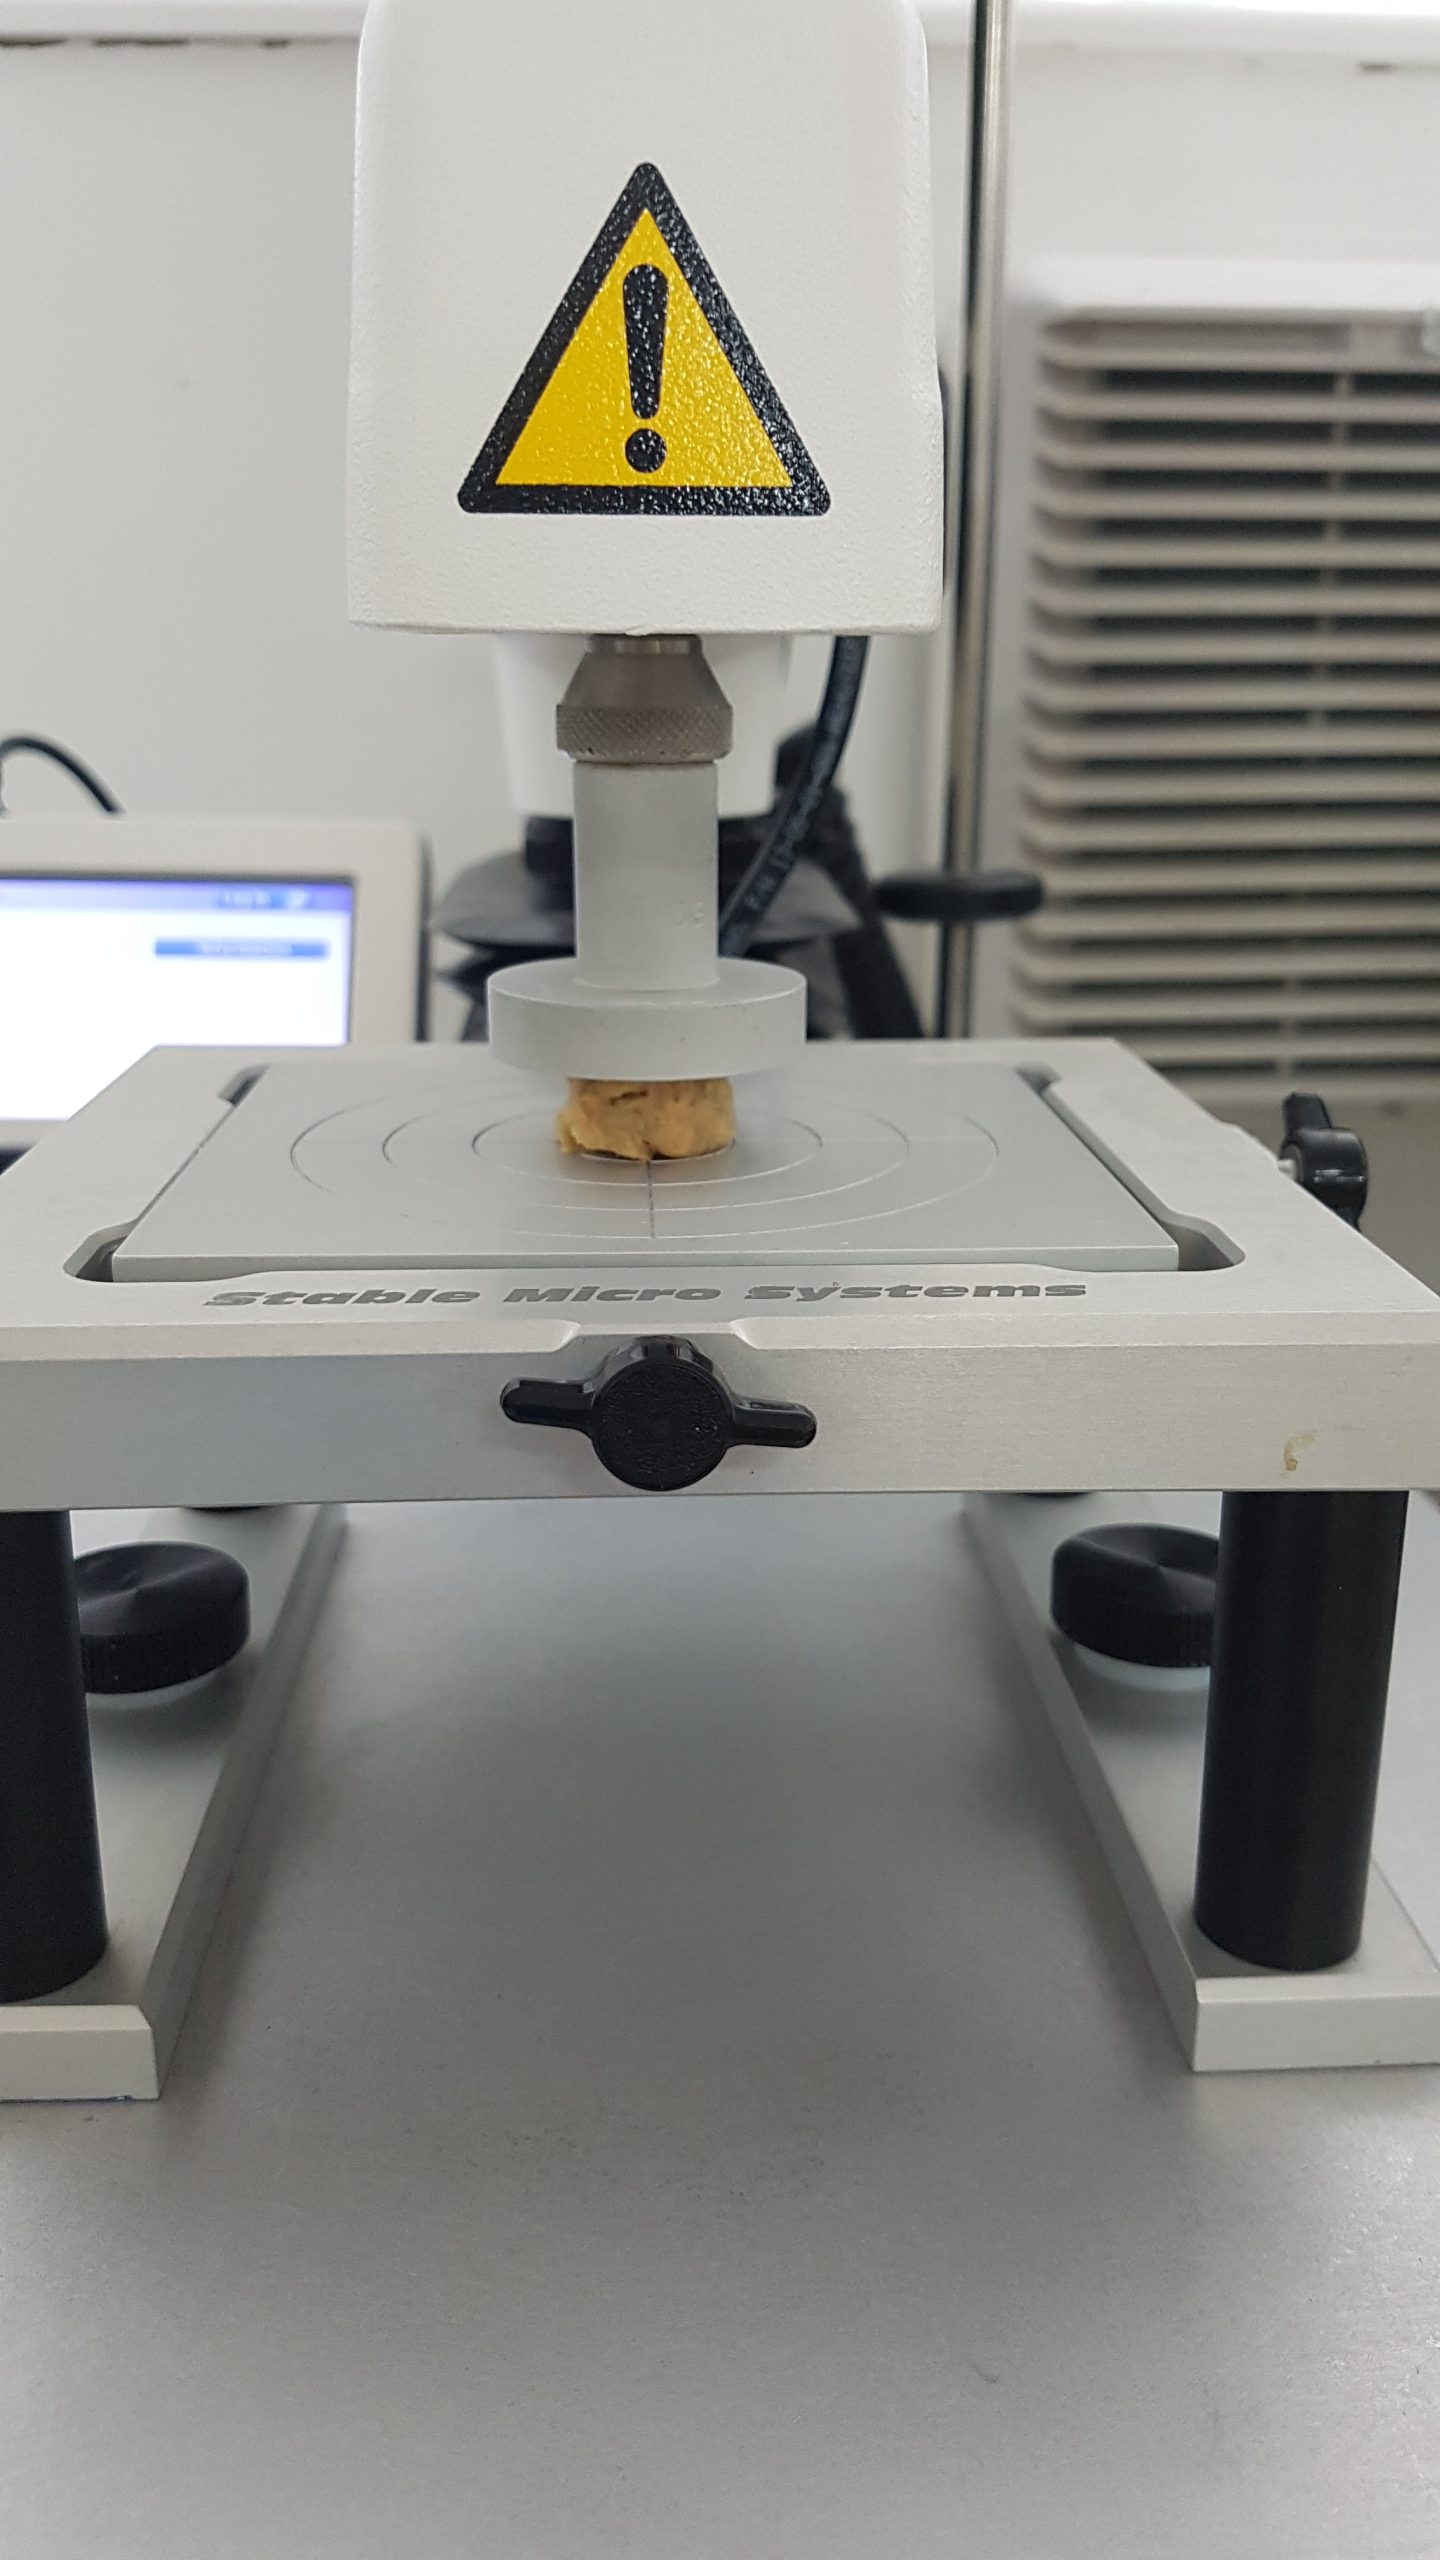
Texture Profile Analysis (TPA) is a stalwart within the food industry and is extensively used across a range of food products. During a TPA test, the sample is subjected to axial pressure that causes deformation. More specifically, TPA testing involves double compression of a sample (i.e. the sample is squashed twice in quick succession) and used to analyse the textural profile of foods during chewing. The reason for double compression is that it acts as a surrogate for biting a sample twice and TPA used to be known as the “two bite test”.
Textural features investigated during a single TPA test can include springiness, cohesiveness, chewiness, hardness and resilience. Combining this with our work determining the yield stress and complex modulus using rheology, which can probe a material’s strength, weakness, wobbliness and rigidity, a comprehensive textural profile of a material can be derived.
Contact us to learn more about the benefits of Texture Profile Analysis
 During TPA testing, a flat plate that is wider than the sample’s diameter is used to compress the sample, allowing the sample to spread as the axial force is increased. The sample is compressed at a set rate for a set time-period, or to a percentage strain, and then released. Usually, strain values of between 25% and 50% are used as they avoid completely deforming the sample. After a delay, the sample is re-compressed using the same conditions as for the first compression, thus recreating a chewing or biting action. The delay between compressions should be adjusted to accurately reflect the chewing regime for the item under study. The difference in data collected between the two compressions is used to derive several parameters such as springiness, cohesiveness, chewiness, hardness and resilience.
During this study, TPA data for a beef burger and a pork sausage were compared with five plant-based meat products (A – E; burgers or sausages) to profile and benchmark them against each other. In this article, the plant-based meat products are referred to as ‘alt-meat’ products.
Quantifying Hardness
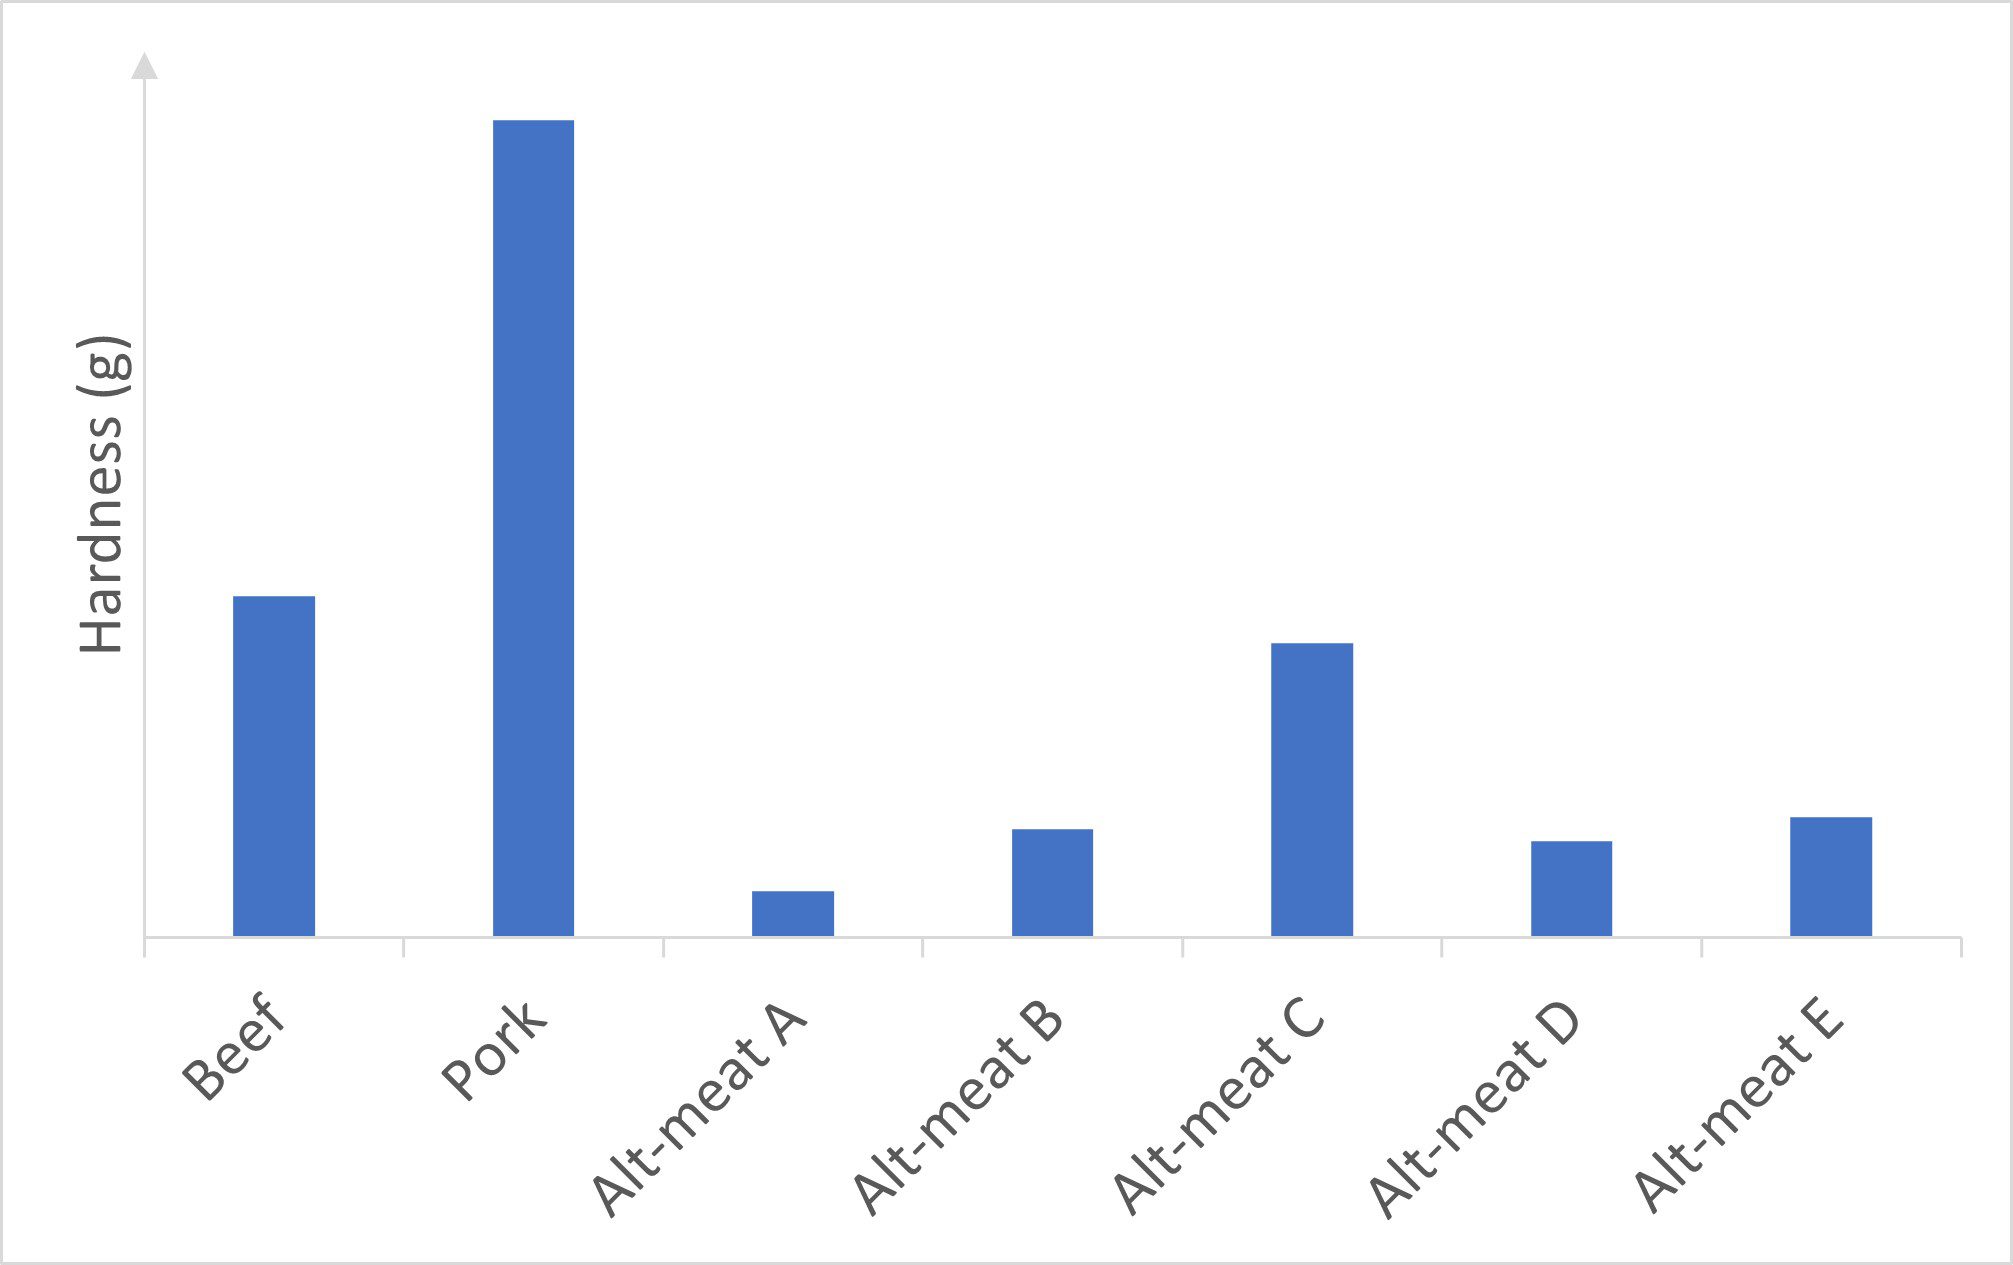
The hardness is quantified as the height of the first peak, i.e. the peak force that occurs during the first compression. Usually, this is the force at the deepest compression but in some cases, for example when a material fractures, this may not be the case and care should be taken to ensure that the largest value is used regardless of when it occurs. The data show that the animal-derived meats are all harder than the plant-based meat products, with the pork sausage identified the hardest meat, Figure 1. Alt-meat products A, B, D and E were arguably similar in terms of hardness, with alt-meat C showing hardness similar to the beef burger.
Chewiness a Useful Indicator for Mouthfeel
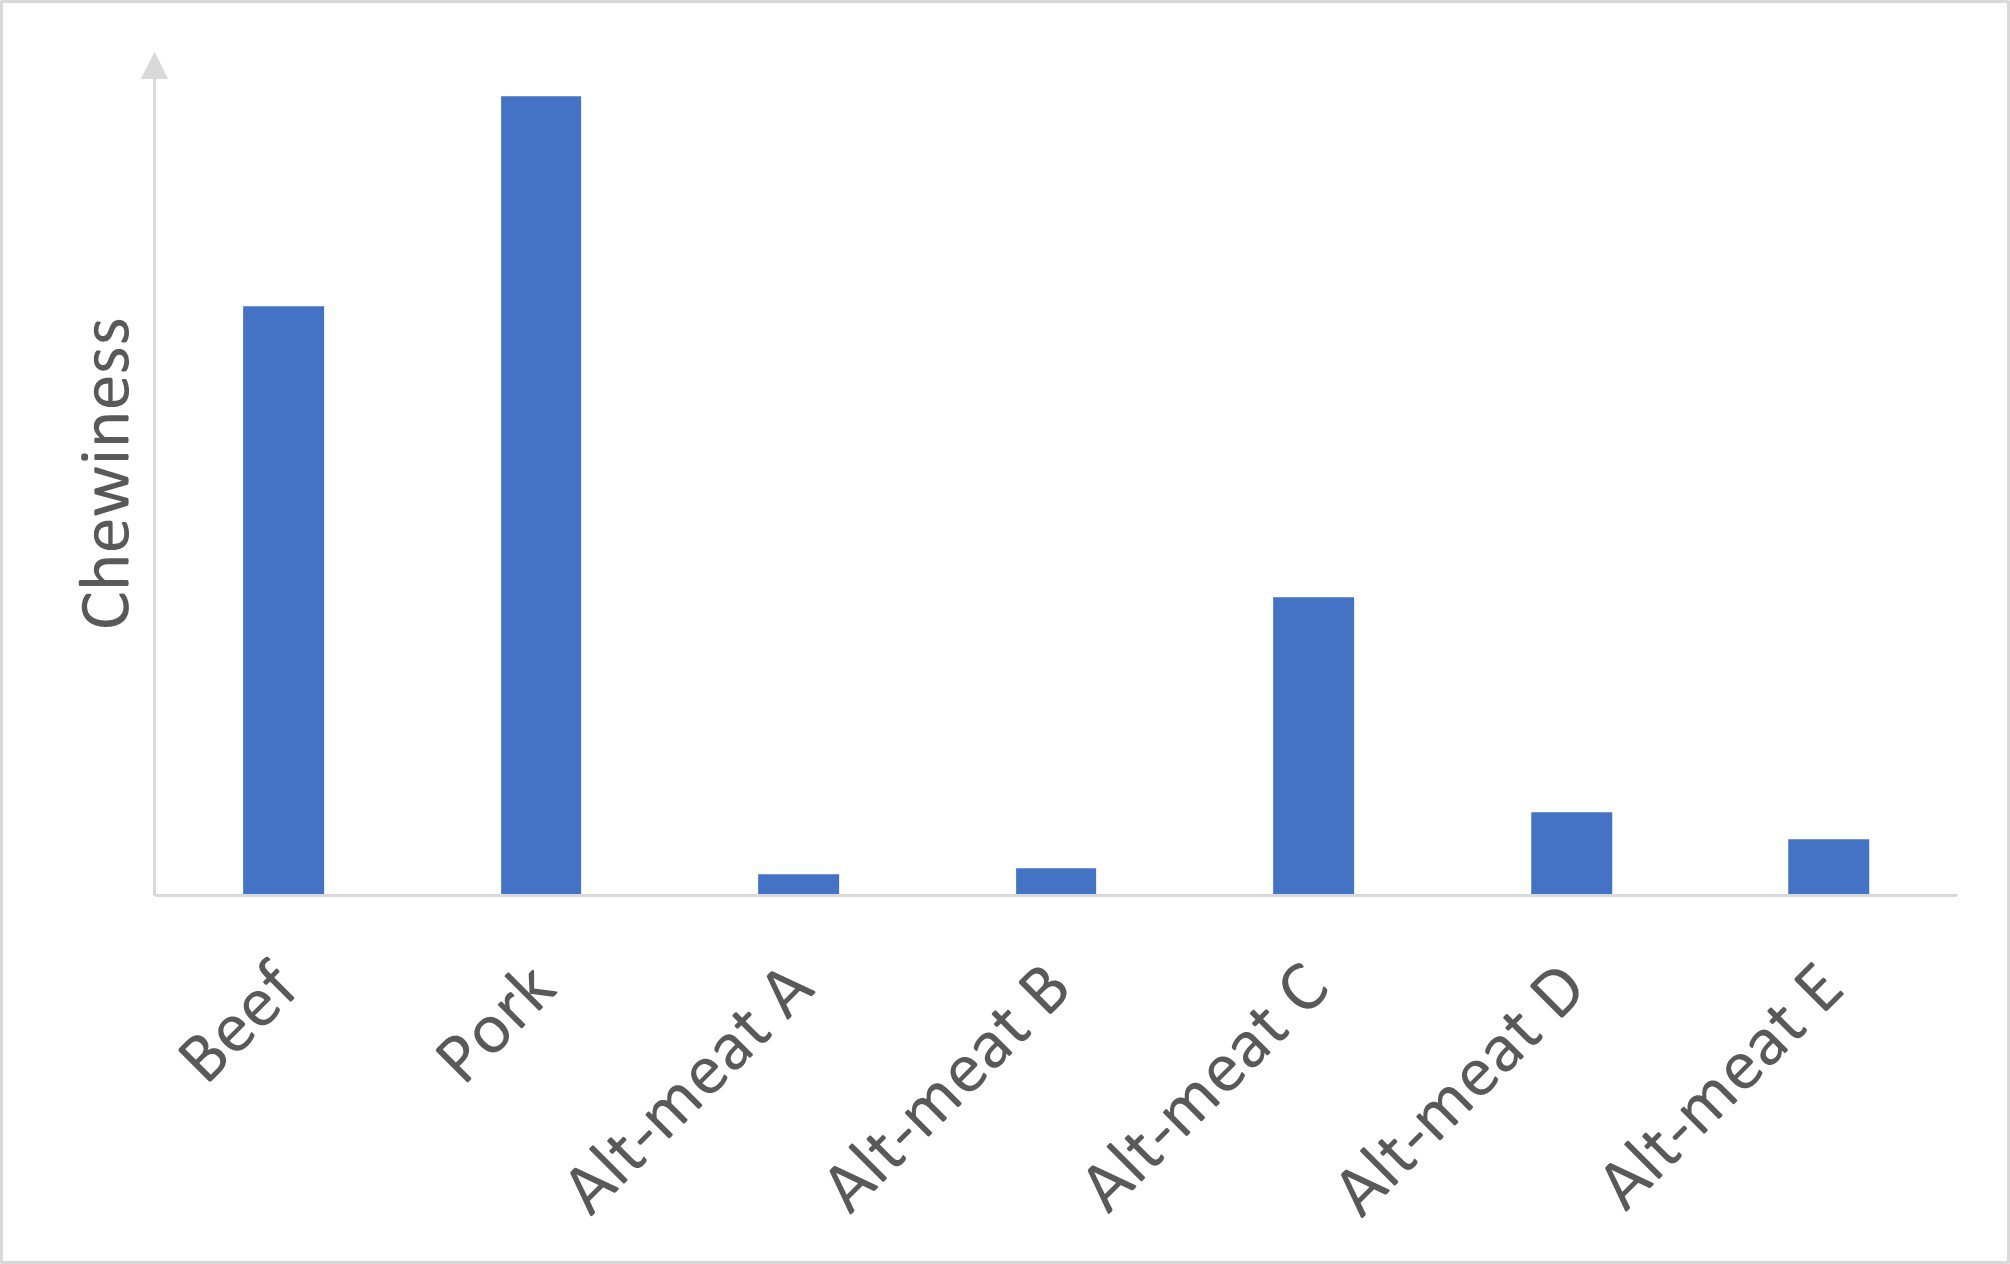
Chewiness is a parameter used for solid foods and is a measure of how much energy is required to chew a particular foodstuff before it can be swallowed and is also a useful indicator for mouthfeel. It is calculated by multiplying the gumminess of a food by the springiness. The difference in chewiness between the animal-derived meats and the plant-based meats is stark, Figure 2. The beef burger and pork sausage both require more energy to chew than the plant-based meats before swallowing. Alt-meat C is the most similar to the animal-derived products, but alt-meats A, B, D and E have low chewiness, comparatively. The implication of this is that the alt-meats might feel more ‘squidgy’ during mastication, or like they have less structure compared to a meat-based product.
Resilience, Real Time Recovery
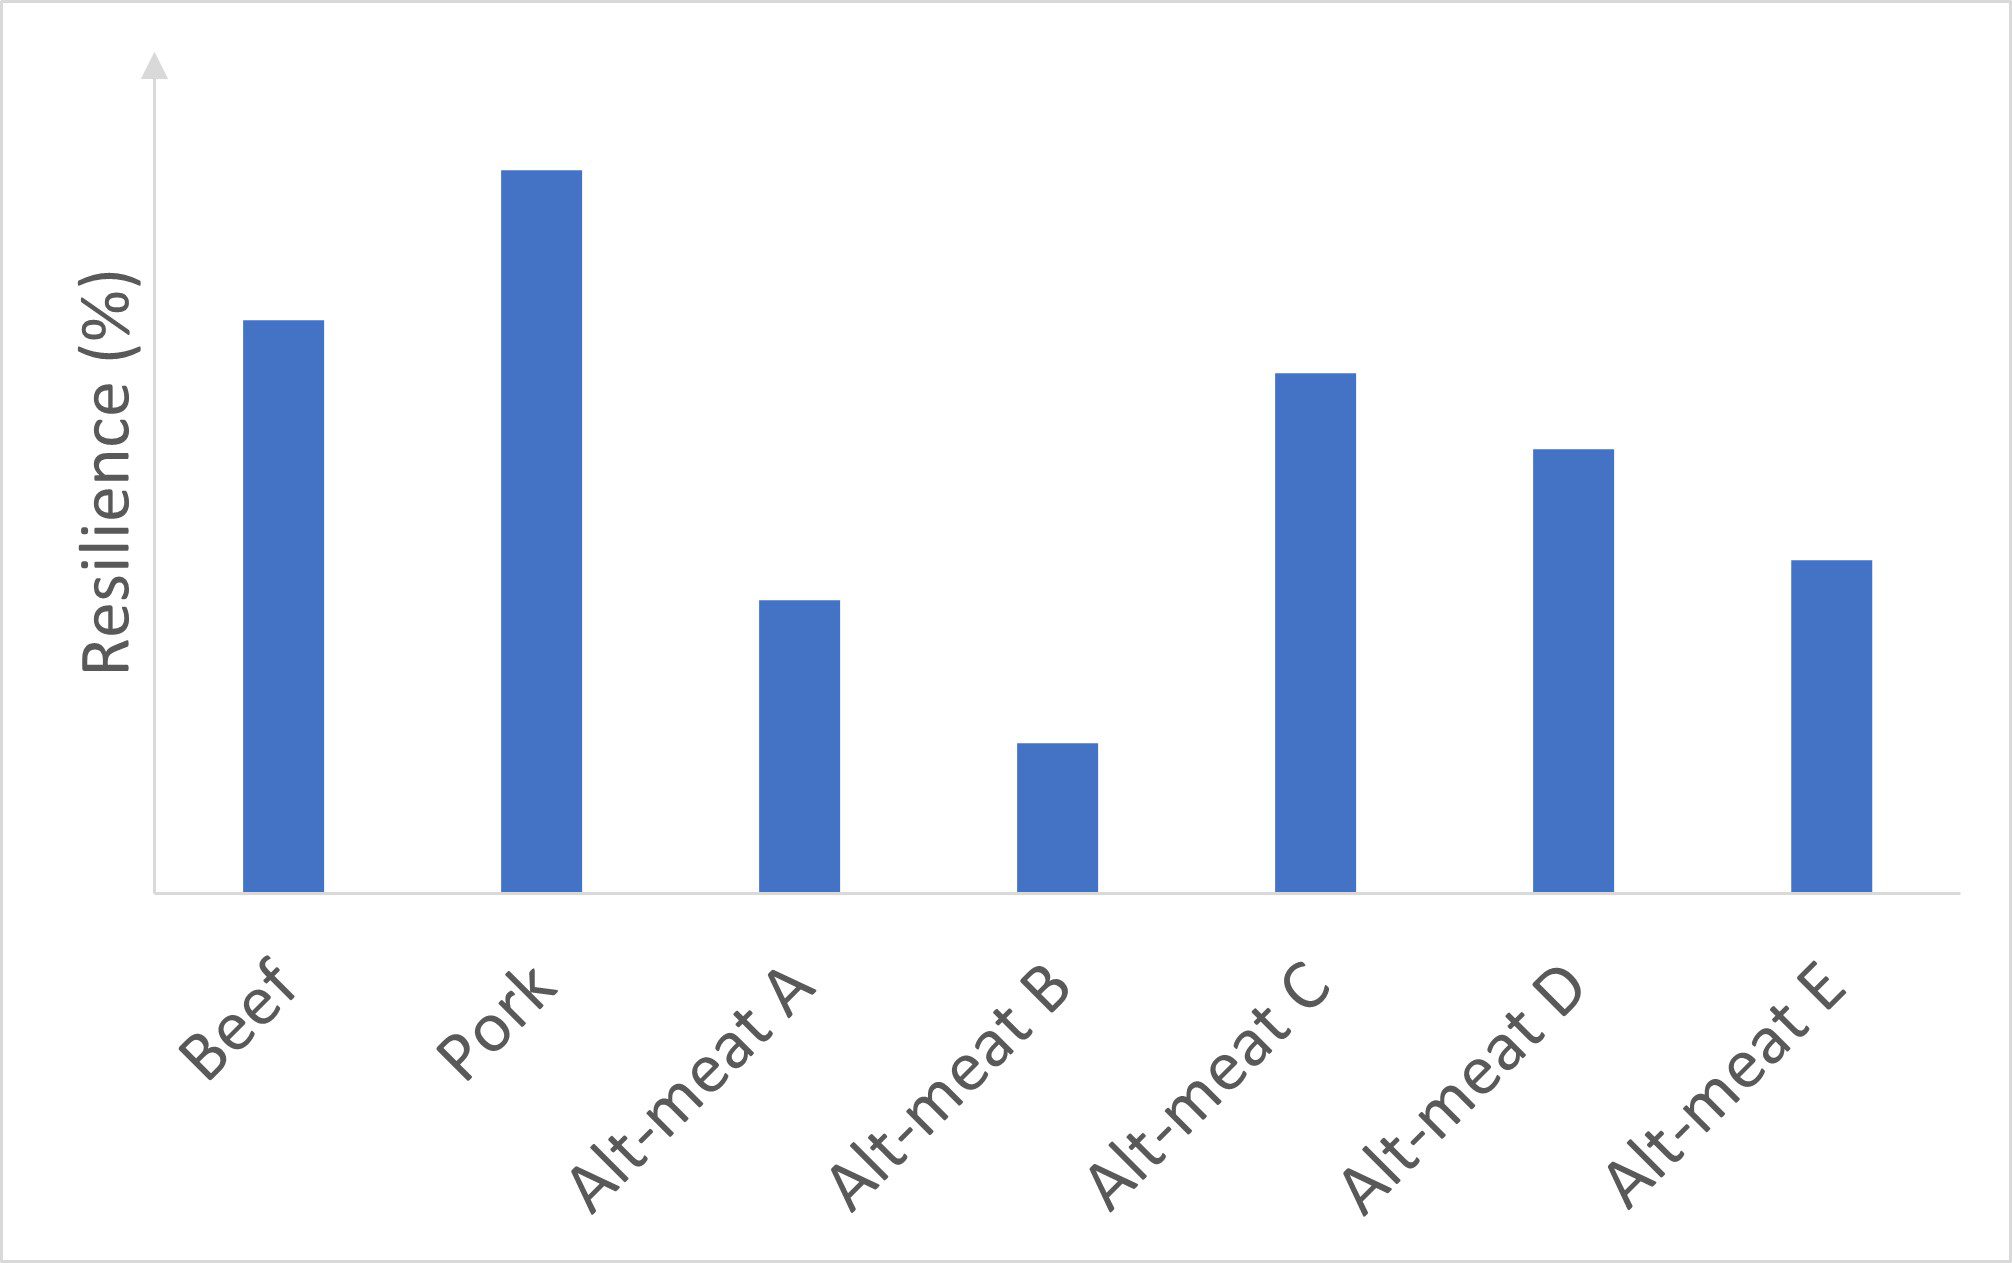
Resilience of a product is a measure of how much a product ‘fights’ to retain its original height after compression. It is different from springiness (see below), as it is the ‘real time’ recovery of the material, whereas the springiness is the recovery after the material has ‘rested’ for a while between compressions.
Data are collected after the downstroke is completed and as the probe withdraws, but before the waiting period. Importantly, the downstroke speed and withdrawal speed need to be identical. A higher percentage resilience shows that the material’s recovery keeps pace with the withdrawing probe, Figure 3. These data show that the pork sausage recovered the largest percentage of height during the probe withdrawal compared to the other samples i.e. when compressed it was able to bounce back quickly. Most of the alt-meats all showed resilience similar to the beef burger, but the clear outlier was alt-meat B, where the resilience was lower than the other samples under study; when compressed, alt-meat B did not ‘fight’ as much to regain the original shape and remained fairly compressed.
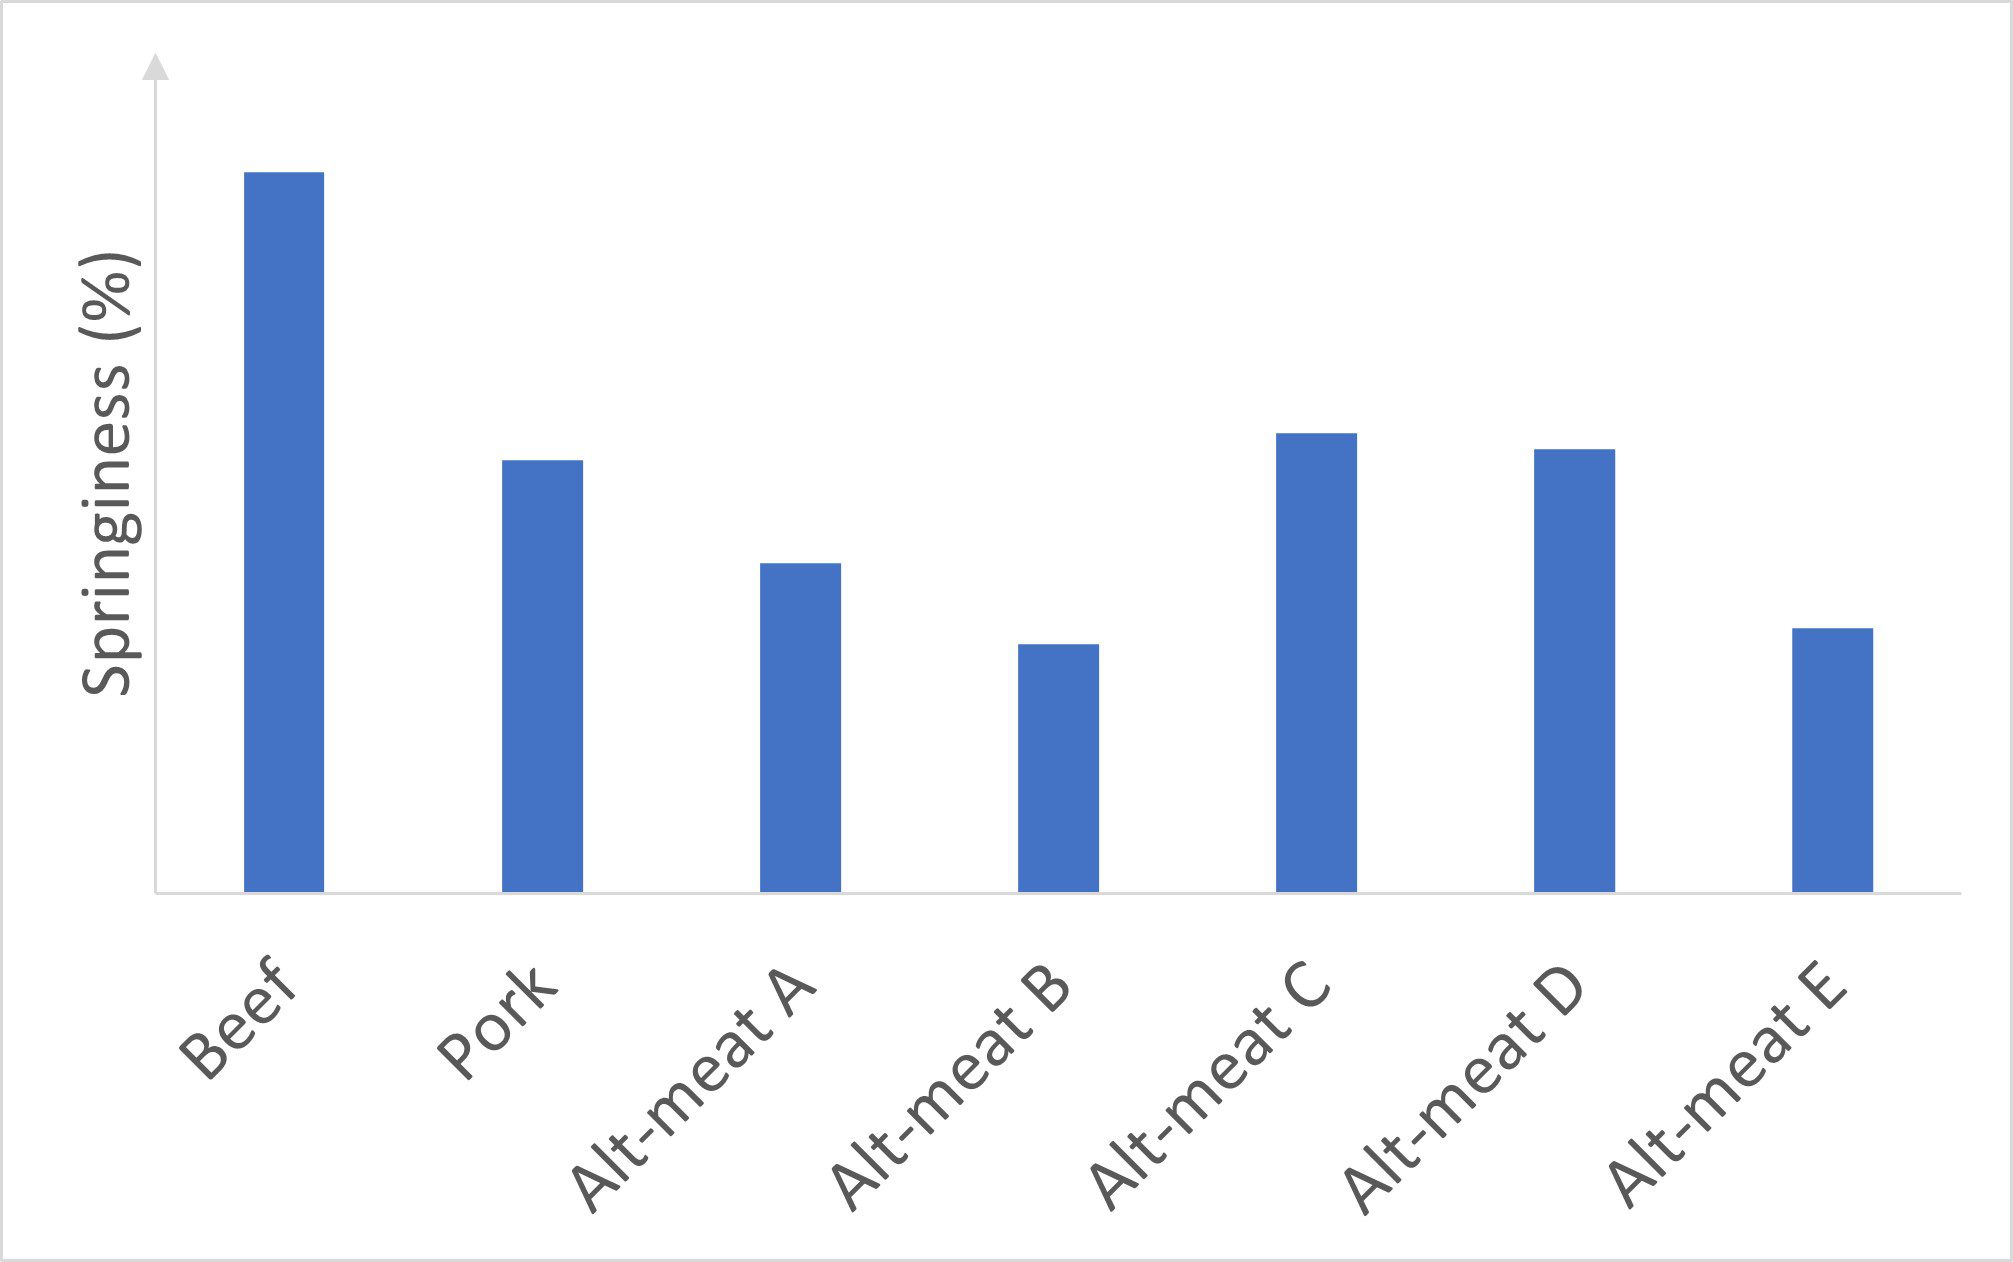
Springiness or ‘Non-Recoverable Deformation’
Springiness is different from resilience in that it is a measure of how well a product bounces back after the set time-period between compression strokes. Springiness is reported as a percentage of the product’s original height. In rheological terms this would be referred to as ‘non-recoverable deformation’. The data show that the beef burger recovers the largest percentage of original height compared to the other products in the study, Figure 4. Alt-meats C and D show springiness like the pork sausage, whereas alt-meats B and E are considerably less springy; when compressed they do not bounce back as well, which may impact upon mouthfeel during consumption and they may feel ‘claggy’. The data collected in this test correlates very well with the yield stress vs complex modulus data collected, which can be used to generate a texture map.
Summary
The use of TPA within food science is a valuable tool to give insight into a product’s behaviour. In this case we considered hardness, chewiness, resilience and springiness. None of the alt-meats studied had a texture profile identical to those of the animal-derived meats, although the springiness and resilience were fairly similar. The biggest differences were relating to chewiness and hardness; the alt-meats were generally less chewy and softer than the animal-derived meats, possibly leading to a soft, slimy mouthfeel. The outlier was alt-meat C, which had a hardness similar to beef and was chewier than the other alt-meats under study, although was less chewy than either beef or pork. Overall, based on the TPA data alone, alt-meat C is most similar to the animal-derived original products.
In summary, TPA can provide valuable data relating to benchmarking of products. Using rheology and TPA in tandem can reveal interesting behavioural features of a foodstuff; properties such as hardness, chewiness, cohesiveness, springiness, resilience, rubberiness, mushiness, brittleness and toughness can all be probed and, more importantly, quantified.