 When designing and developing a paint product there are two main rheological aspects that must be considered. Firstly, there is the rheological behaviour of the bulk material, which is related to storage and application. Secondly, there is the interfacial rheological, or filming, behaviour, which is related to how the material dries once it has been applied.
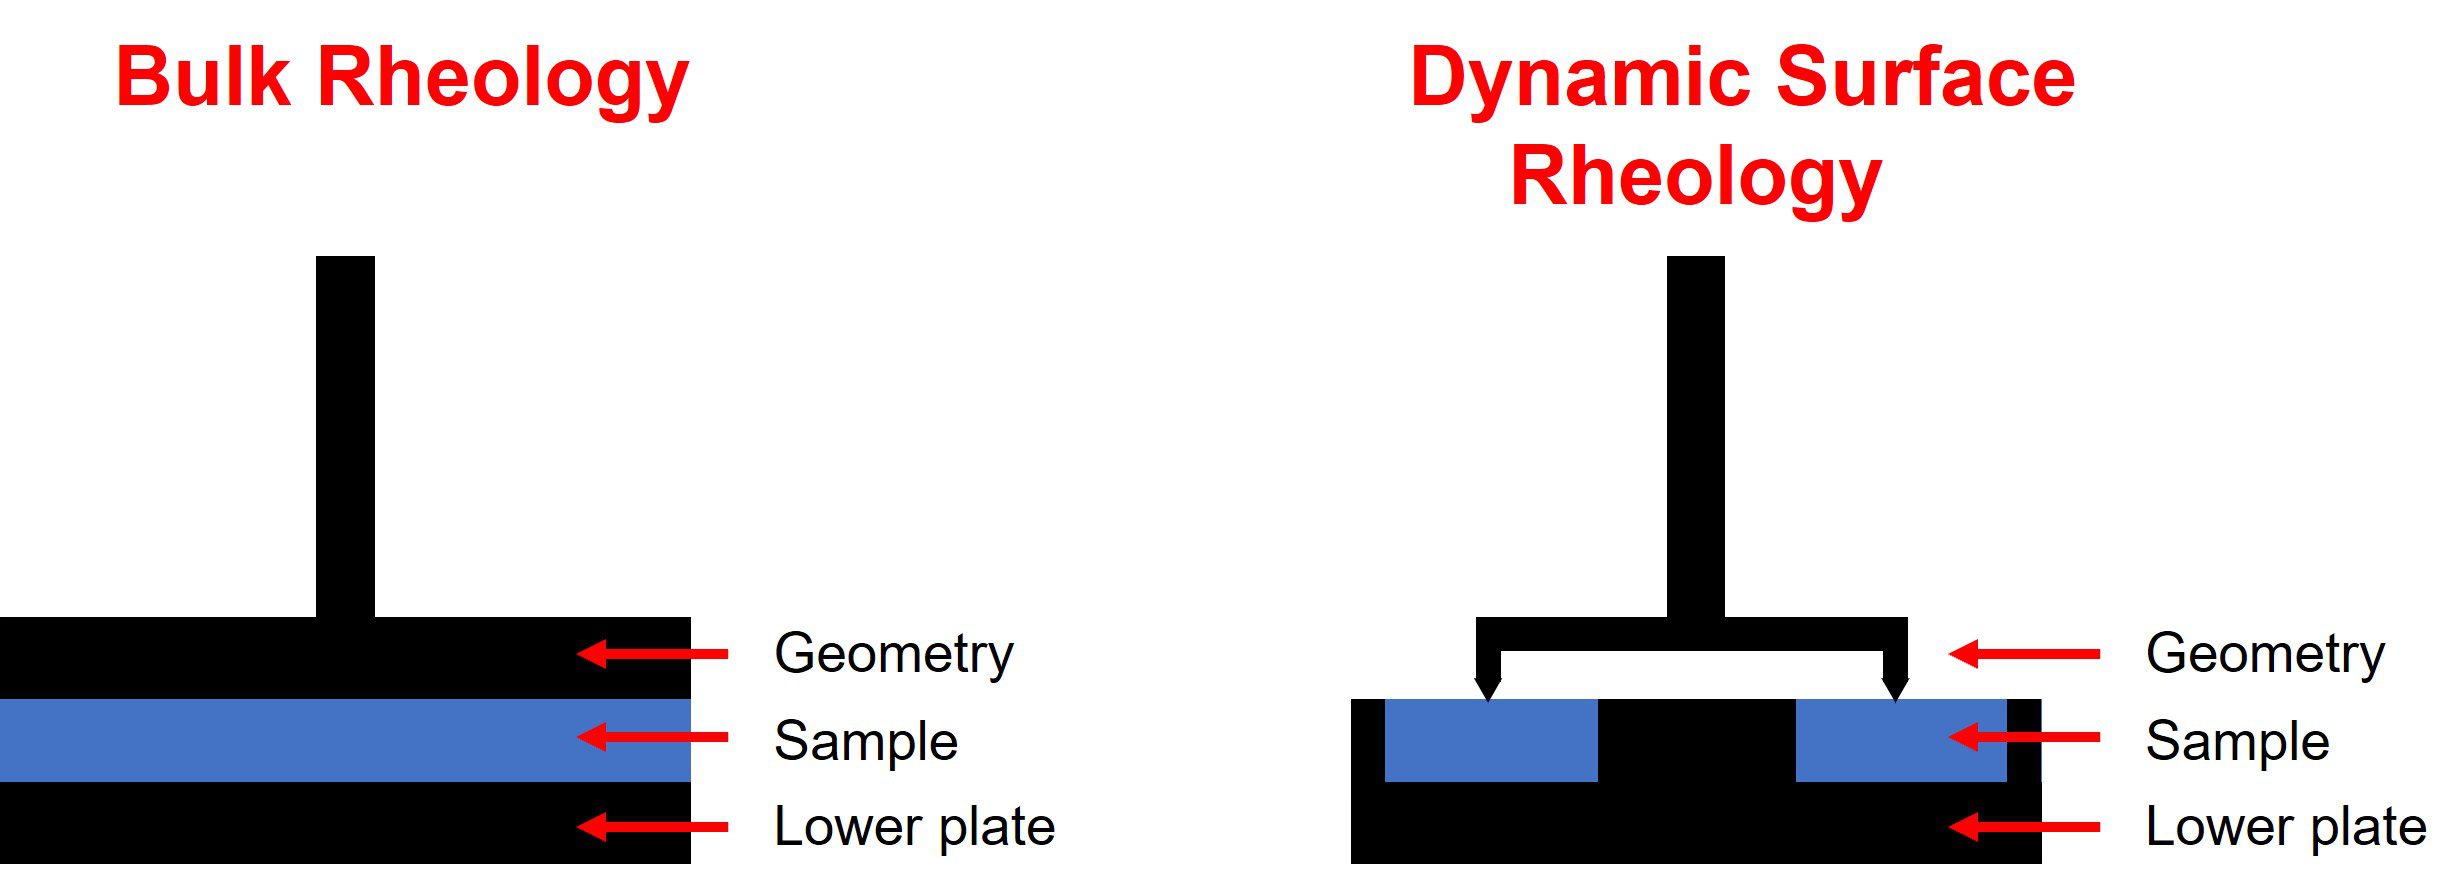
The rheological behaviour of a bulk material can be interrogated using ‘traditional’ rheology where a sample is placed between an upper geometry and a lower plate, and is well-established within the paints and coatings industry. Dynamic surface rheometry is an under-exploited tool that can be used to monitor rheological behaviour at an interface and can provide insights into the filming behaviour of a product.
Contact us to arrange a lab tour and discuss rheological techniques with our experts
 The rheology of paints is extremely important and plays a vital part in both consumer experience and product performance. It has been claimed by some experienced formulators that as much as half of the cost of new product development can be consumed in ‘getting the rheology right’.
When developing a new paint formulation, several aspects need to be optimised including sag resistance, brushability, long-term stability and levelling properties. These characteristics can all be interrogated using bulk rheological techniques. For example, by using an oscillatory test, the strength and rigidity of the bulk structure, as well as dominance of elastic or viscous response when handling the material, can be probed by considering the storage and loss moduli and the yield stress. ‘Yielding’ represents a change from an elastic solid to a viscous liquid, or more specifically for paint, a percolating microstructural state to a non-percolating condition that may retain some degree of flocculation. These data may be useful to know when processing the paint, for example transferring from one container to another or when applying the paint either with a roller or brush, as they provide information in relation to how much pressure is required to flow the material. However, the rheology of the bulk is not necessarily the same as the rheology at the interface and by only considering one aspect, key behaviours and properties may be missed.
For an excellent overview of rheology within the paints and coatings industry, see this article by Richard Eley.
Rheological Approaches for MFFT

The Minimum Film Forming Temperature (MFFT) is the lowest temperature at which a paint or coating will uniformly coalesce when it is laid upon a substrate. It is possible to compare the curing or drying performance of film-forming materials using dynamic surface rheometry. Using this technique, film formation in relation to time and temperature can be probed, as well as the rigidity and strength of the film once it has been formed.
Where bulk rheology usually involves placing a sample between the base-plate and geometry and measuring how the whole sample moves, dynamic surface rheometry involves loading the sample into a trough and then placing a ring geometry on the surface. This leaves a portion of the sample open to the air so that a film can form around the surface of the ring that is touching the interface.
Case study: Bulk and film rheology of paints
The bulk and interfacial properties of five paints were studied using ‘traditional’ bulk rheology and dynamic surface rheometry.
- Paint A – Mid-price range, water-based durable bathroom paint
- Paint B – Mid-price range, water-based interior emulsion
- Paint C – High-price range, water-based interior emulsion
- Paint D – Low-price range, water-based durable bathroom paint
- Paint E – Low-price range, water-based furniture paint
Testing of bulk rheological properties
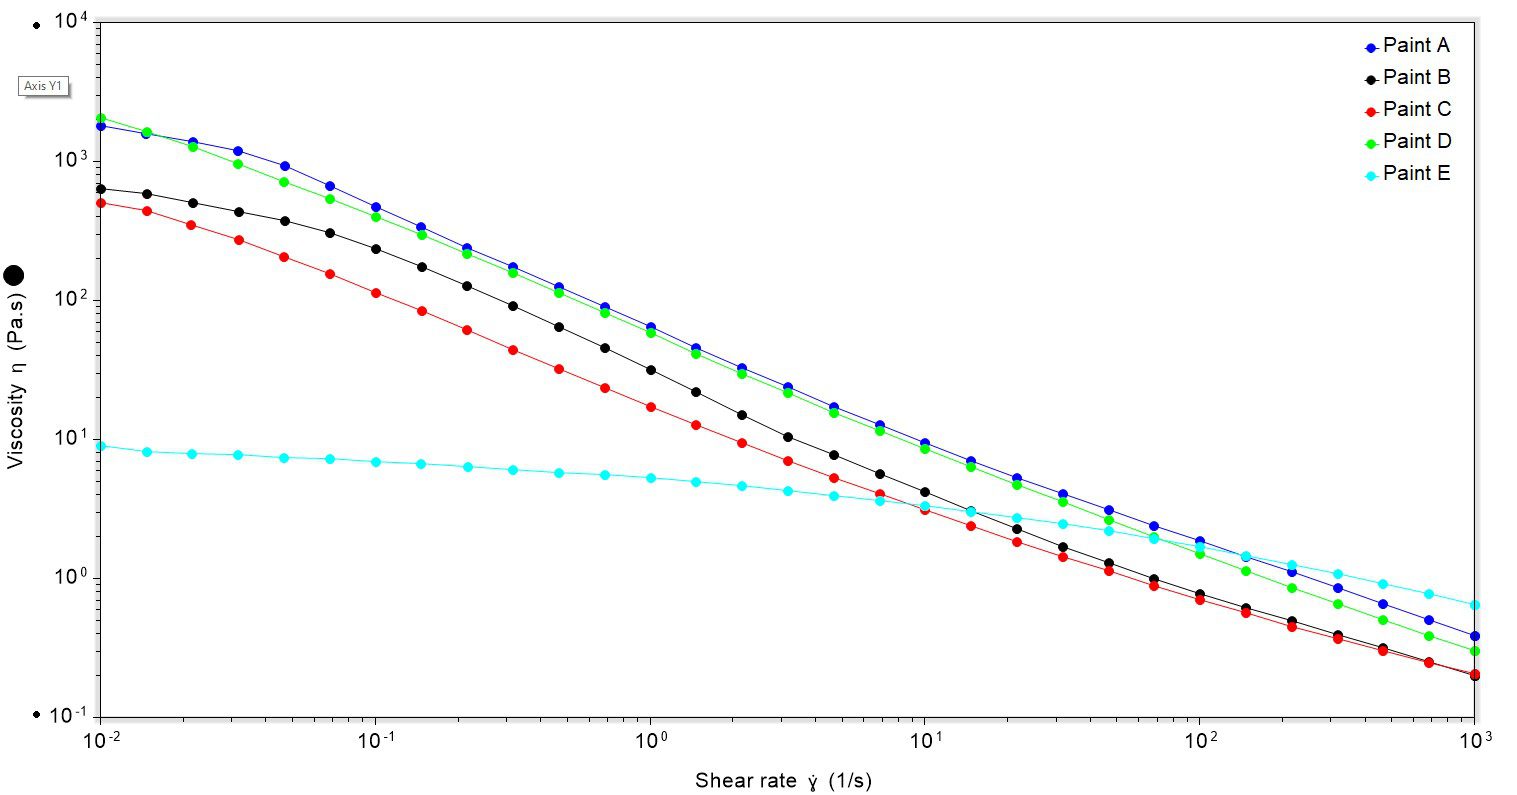
The first experiment conducted was a controlled shear-rate viscosity profile. This test allows for facile identification of differences in viscosity and behaviour under a range of shear conditions. Considering the data, most of the paints behaved very similarly: most had a similar viscosity at low shear rates; most tended towards a first-Newtonian, or zero-shear, plateau at lower shear rates; and most were shear-thinning i.e. as shear rate increased the viscosity decreased, Figure 1. However, there were some trends or outliers that require further discussion:
- Paint E had an initial viscosity that was much lower than for the other samples.
- Paint E showed flow behaviour that was near-Newtonian, and a significant change in viscosity was only observed at higher shear rates.
- Under the shear rates studied, Paint D did not tend towards a zero-shear plateau.
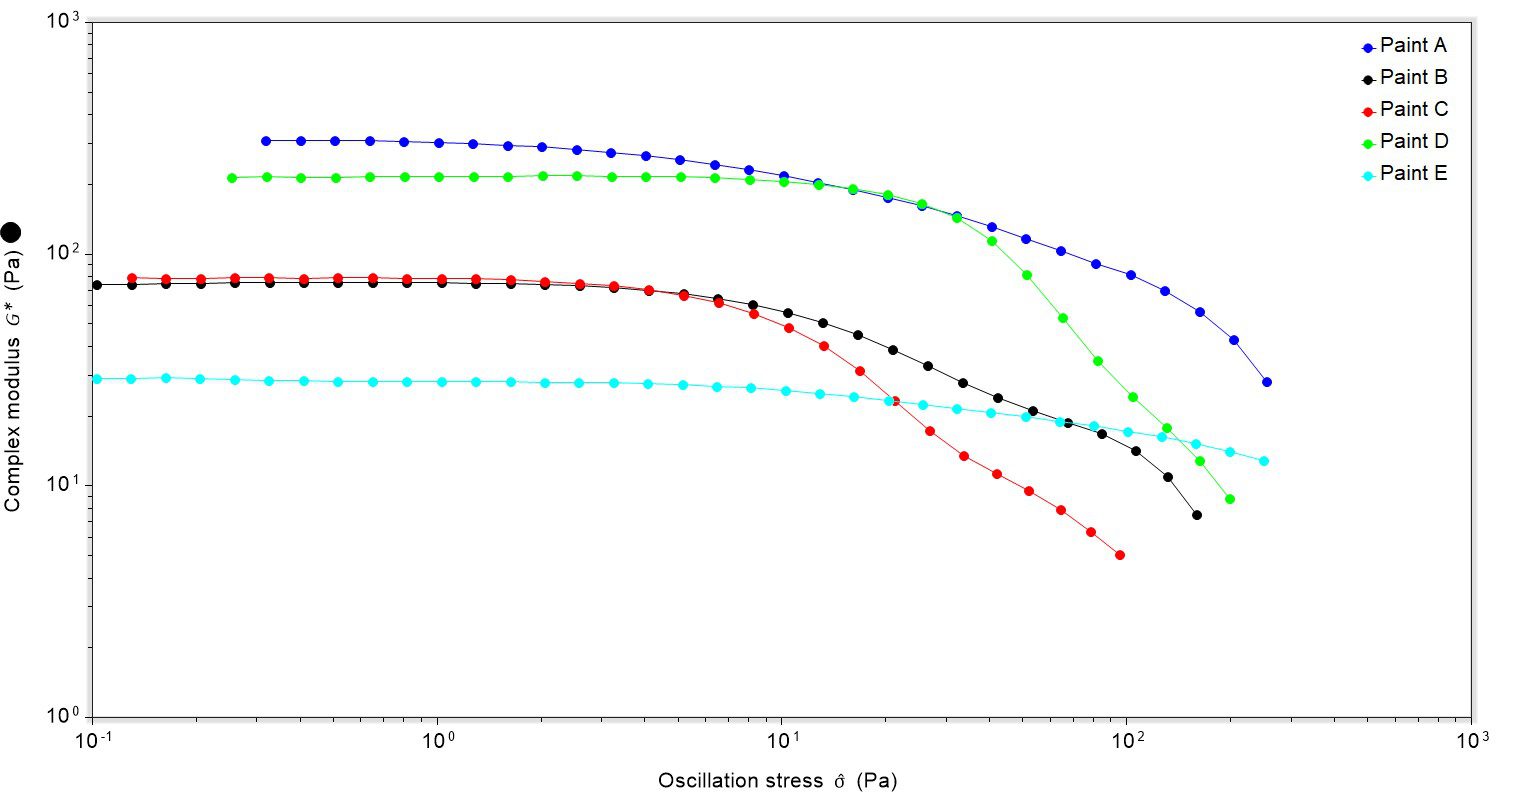
Oscillatory tests were also undertaken on the bulk materials to probe the internal structure. In particular we were interested in the rigidity of the material, which was ascertained from the complex modulus, Figure 2. There were three clear divisions between the samples: Paints A and D, Paints B and C, then finally Paint E. Paints A and D were most rigid at low oscillation stress, and Paint E was the least rigid.
The point at which the complex modulus deviates away from a plateau can be one measure of yield stress i.e. the point at which the oscillation stress starts to cause irrecoverable deformation. Using this technique, it can be seen that Paint C has the lowest yield stress (8.37 Pa) and Paint A the highest (33.77 Pa).
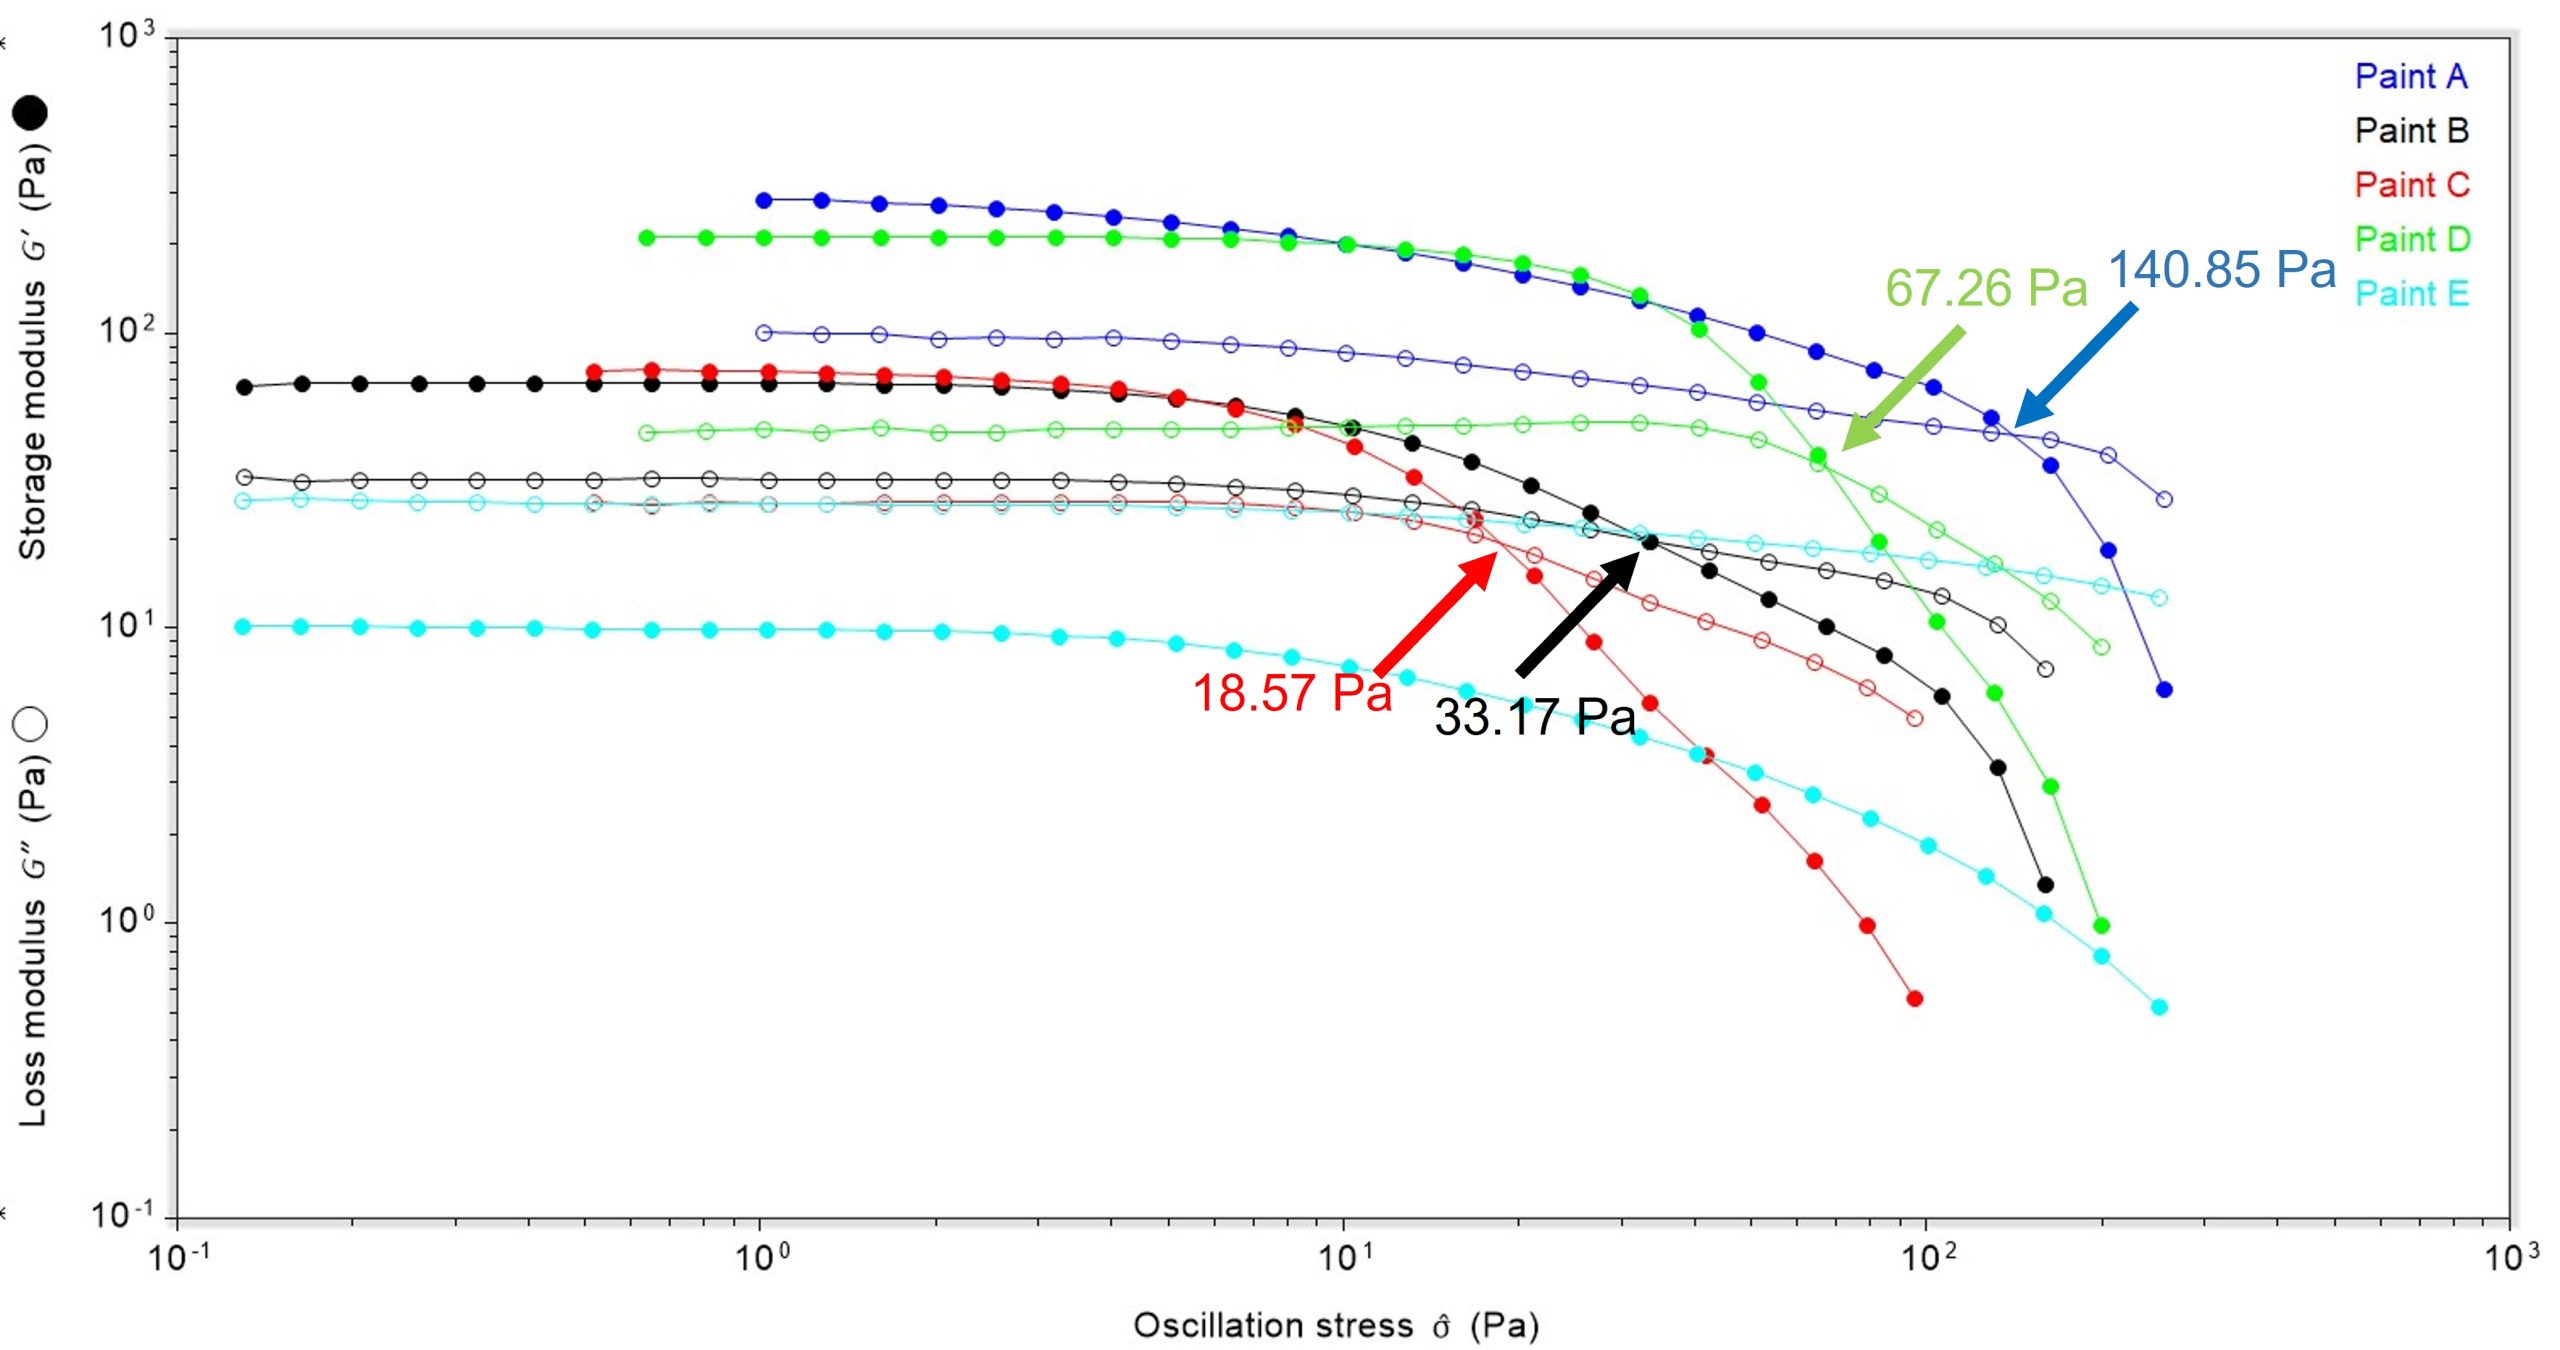
Another output from an oscillatory test are the storage and loss modulus data. The relationship between the storage and loss moduli can reveal if a material is solid or liquid dominant. The point at which this relationship changes and the moduli cross can also be used as an indicator for yield stress and the advent of ‘significant irreversible deformation’ or a shift from solid-dominant to liquid-dominant behaviour.
The storage and loss modulus data unveiled some interesting behaviours that were not necessarily obvious from the complex modulus data, Figure 3. For example:
- Paints A – D showed a larger storage modulus, indicating solid-dominant behaviour. In contrast, Paint E had a larger loss modulus, suggesting liquid-dominant behaviour.
- The difference in the magnitude of storage and loss modulus also varied between samples, with paints A and D having the largest difference. This arguably had an impact upon the modulus cross-over point, and therefore the yield stress.
As noted above, the point at which the moduli cross can be taken as the ‘yield stress’, which is the point at which applying a stress leads to significant deformation, or flow, of the material. Using the cross-over technique, Paint A had the highest yield stress (143 Pa) and Paint C had the lowest yield stress (19 Pa). It should be noted that these yield stresses are higher than the yield stresses by the complex modulus method, and are commonly considered as the point at which significant irreversible deformation has occurred and behaviour has switched from solid-dominant to liquid-dominant.
Paint E did not show a cross-over point because from low oscillation stresses the loss modulus was already dominant. This means that the cross-over technique is not appropriate in this case, and the complex modulus needs to be used to determine yield stress.
Testing of Dynamic Surface Rheometry (DSR)
The first DSR experiment was to look at film formation at 25 °C over time, Figure 4. By considering the complex modulus of the interface with respect to time, a picture of the filming behaviour can be derived.
The order of paint rigidity at the interface generally mirrors that shown by the oscillatory test of the bulk material, with Paint A being the most rigid and Paint E being the least rigid at the start of the experiment. Interestingly, there is a sizable difference between the complex modulus values of Paints B and C whereas in the bulk they were similar. However, caution should be exercised as the dynamic surface rheometry attachment uses different units for the complex modulus (Pa in bulk and N/m at the interface), therefore direct comparison is not easily possible.
As the material is left open to air it can be seen that the complex modulus increases over time, which suggests that a film is forming. However, the rate of film formation varies across the samples as shown by the variation in gradient and the order of rigidity of the samples after 30 minutes has changed.
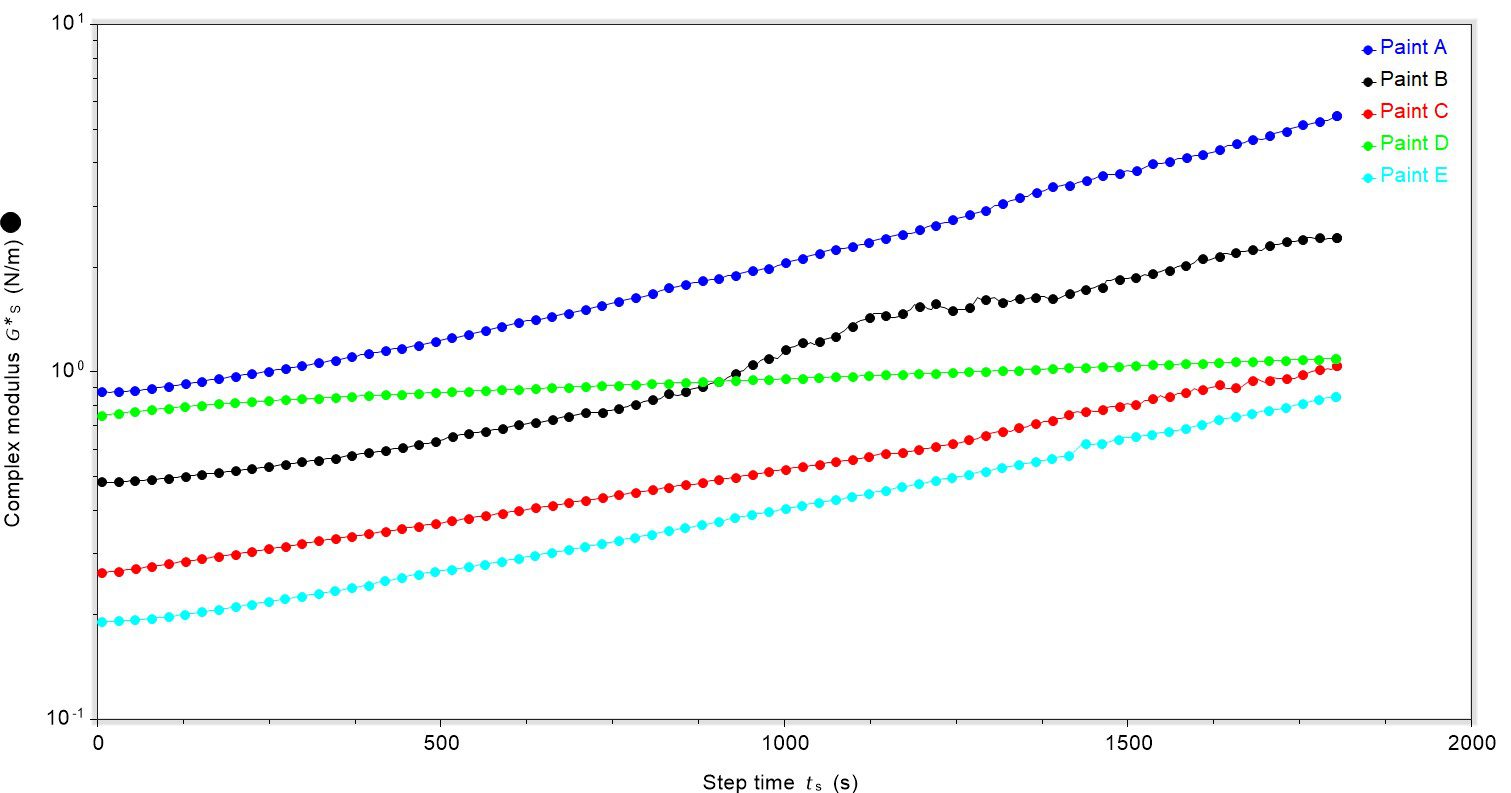
The gradient of the slope, and hence the rate of film formation, can be calculated and provides a means for comparing examples.
Sample Rate of Complex Modulus Increase (Nm-1s-1)
Paint A 4.5 x 10⁻⁴
Paint B 3.2 x 10⁻⁴
Paint C 3.1 x 10⁻⁴
Paint D 8.2 x 10⁻⁵
Paint E 3.6 x 10⁻⁴
Using these data, it can clearly be seen that Paints A, B, C and E show a similar rate of complex modulus increase, and by extension rate of film formation on the surface. However, Paint D has a much slower rate of complex modulus increase, suggesting that film formation is slower.
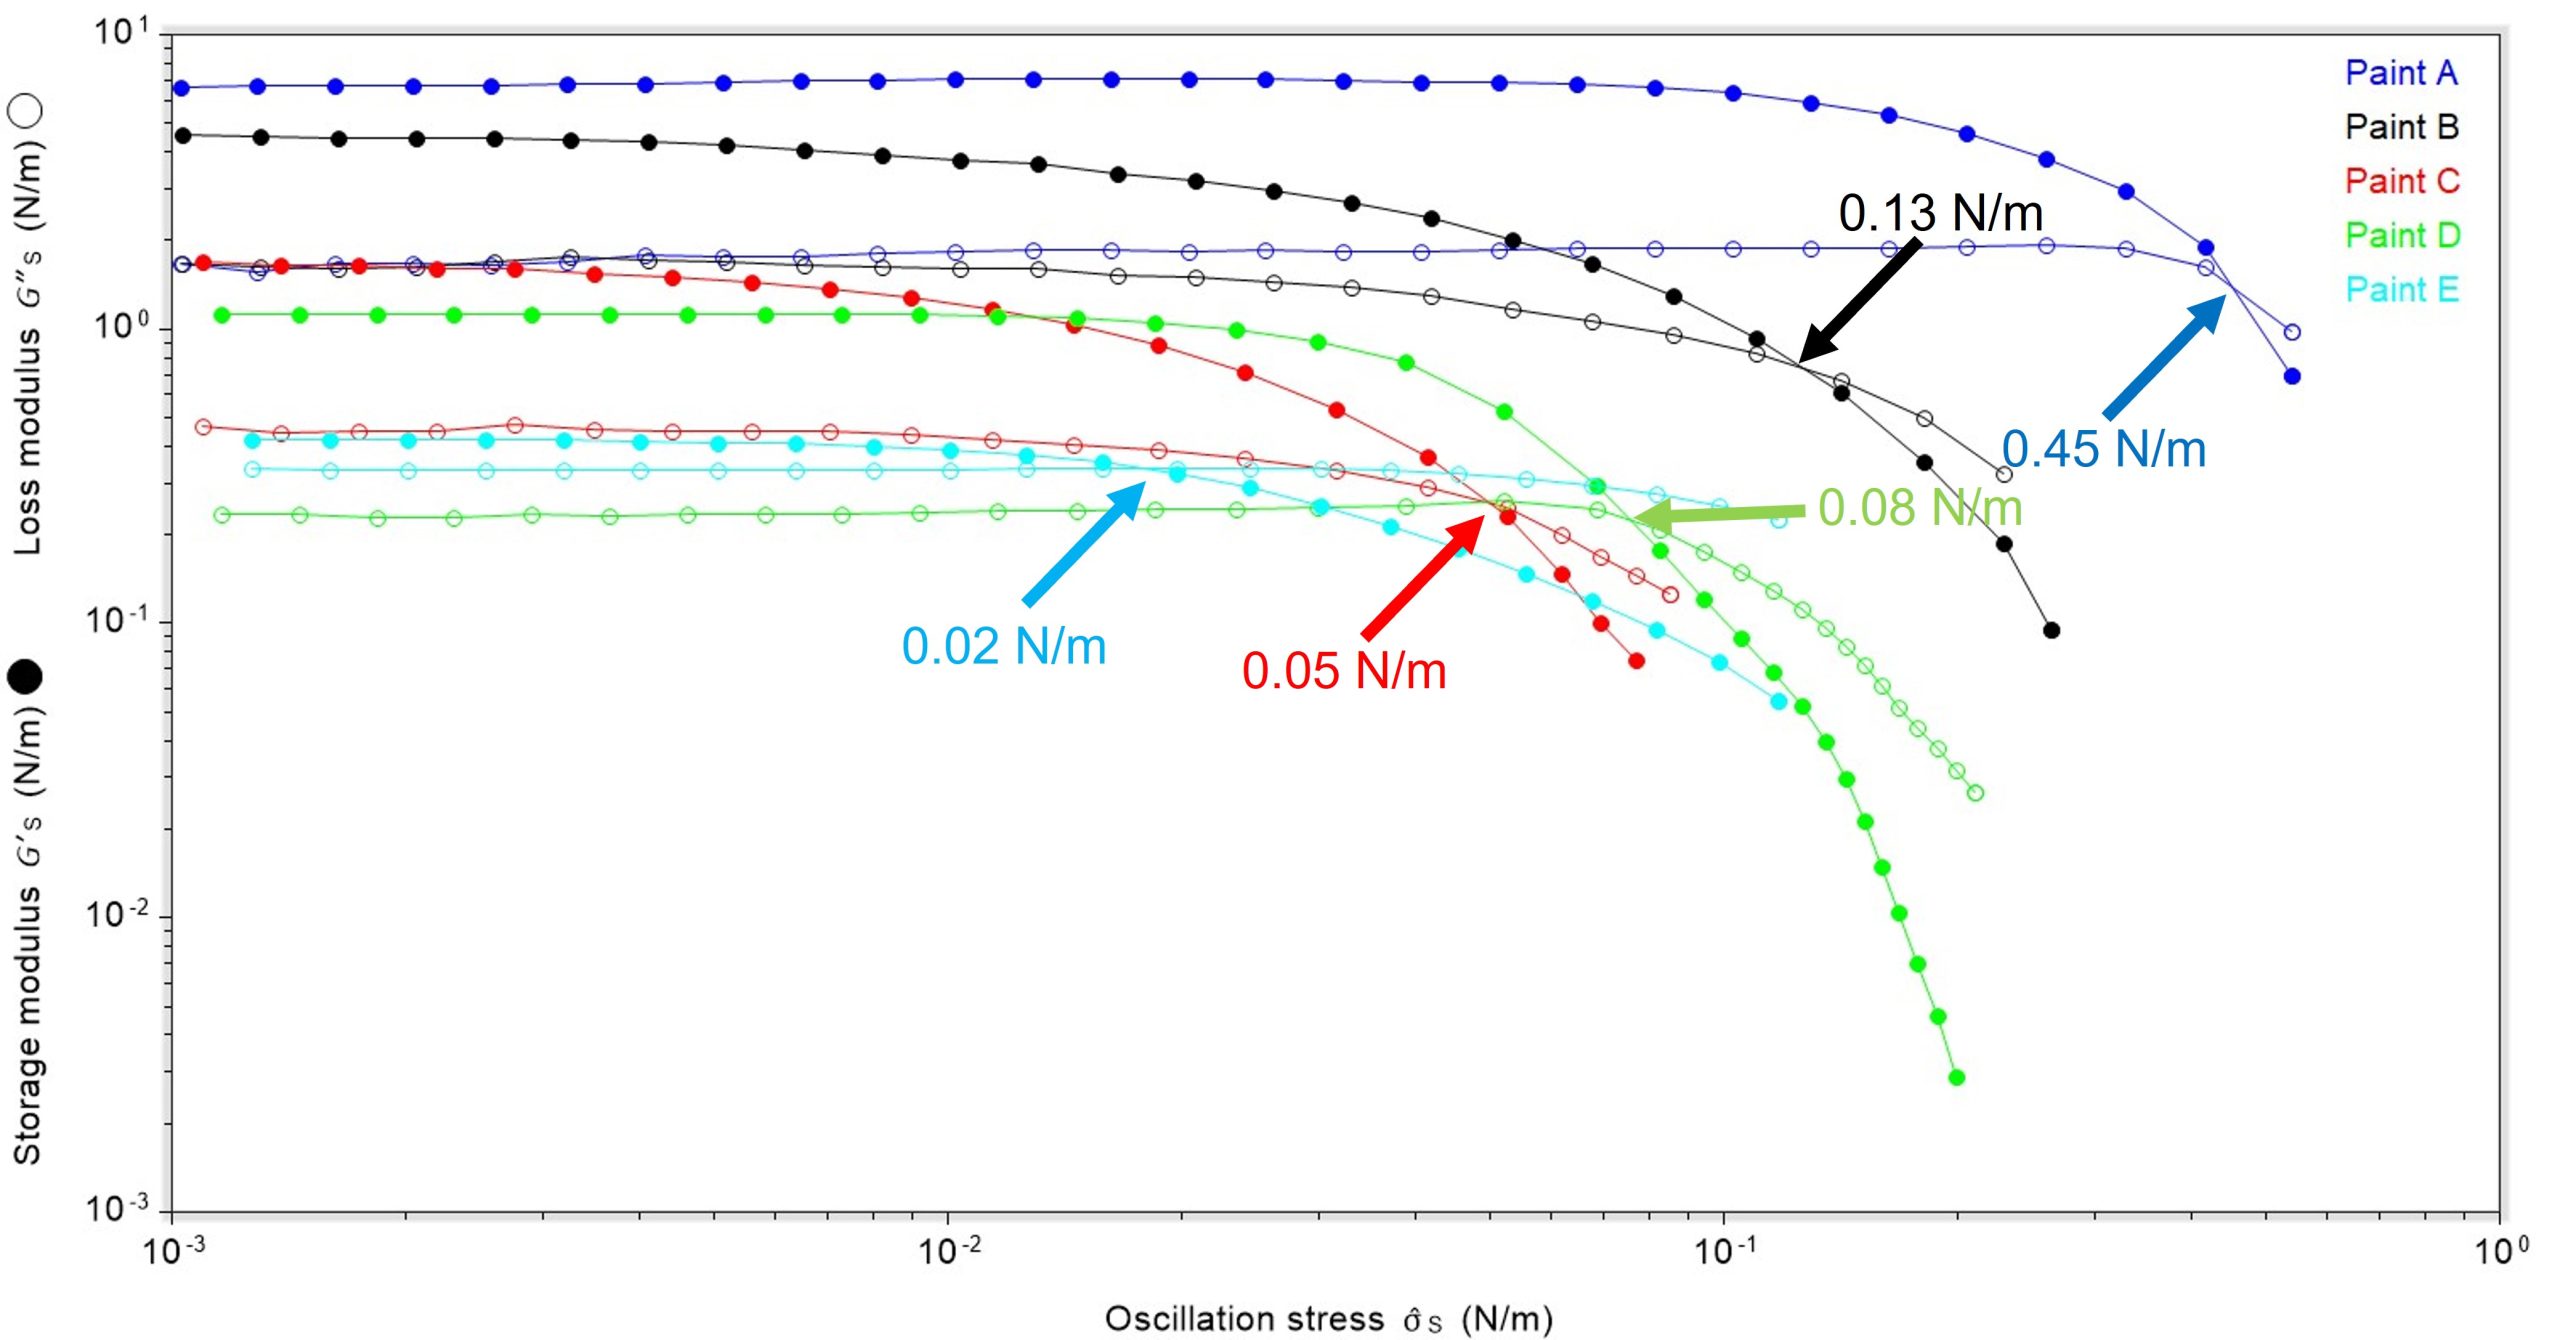
The second test completed was an oscillatory stress sweep of the interface after 30 minutes of film formation. This was designed to probe the strength of any film formed.
In all cases, after 30 minutes the storage modulus at the interface was larger than the loss modulus even if the loss modulus was larger than the storage modulus as the beginning of the experiment (Paint E), therefore solid-like behaviour dominated, Figure 5. The paint with the largest yield stress, indicated in this case by a cross-over in the storage and loss moduli, was Paint A. Paint E had the lowest yield stress.
In summary, we have collected bulk and dynamic surface rheological data for five emulsions. The results have shown clear differences in the bulk rheological properties and the film-forming behaviour. Considering that as much as half of the developmental budget for paints and coatings can be spent on ‘getting the rheology right’, the advent of a rheological technique to monitor film formation could be a very powerful technique and provide an additional tool for formulators, research and development scientists and those involved in paint and coatings development.
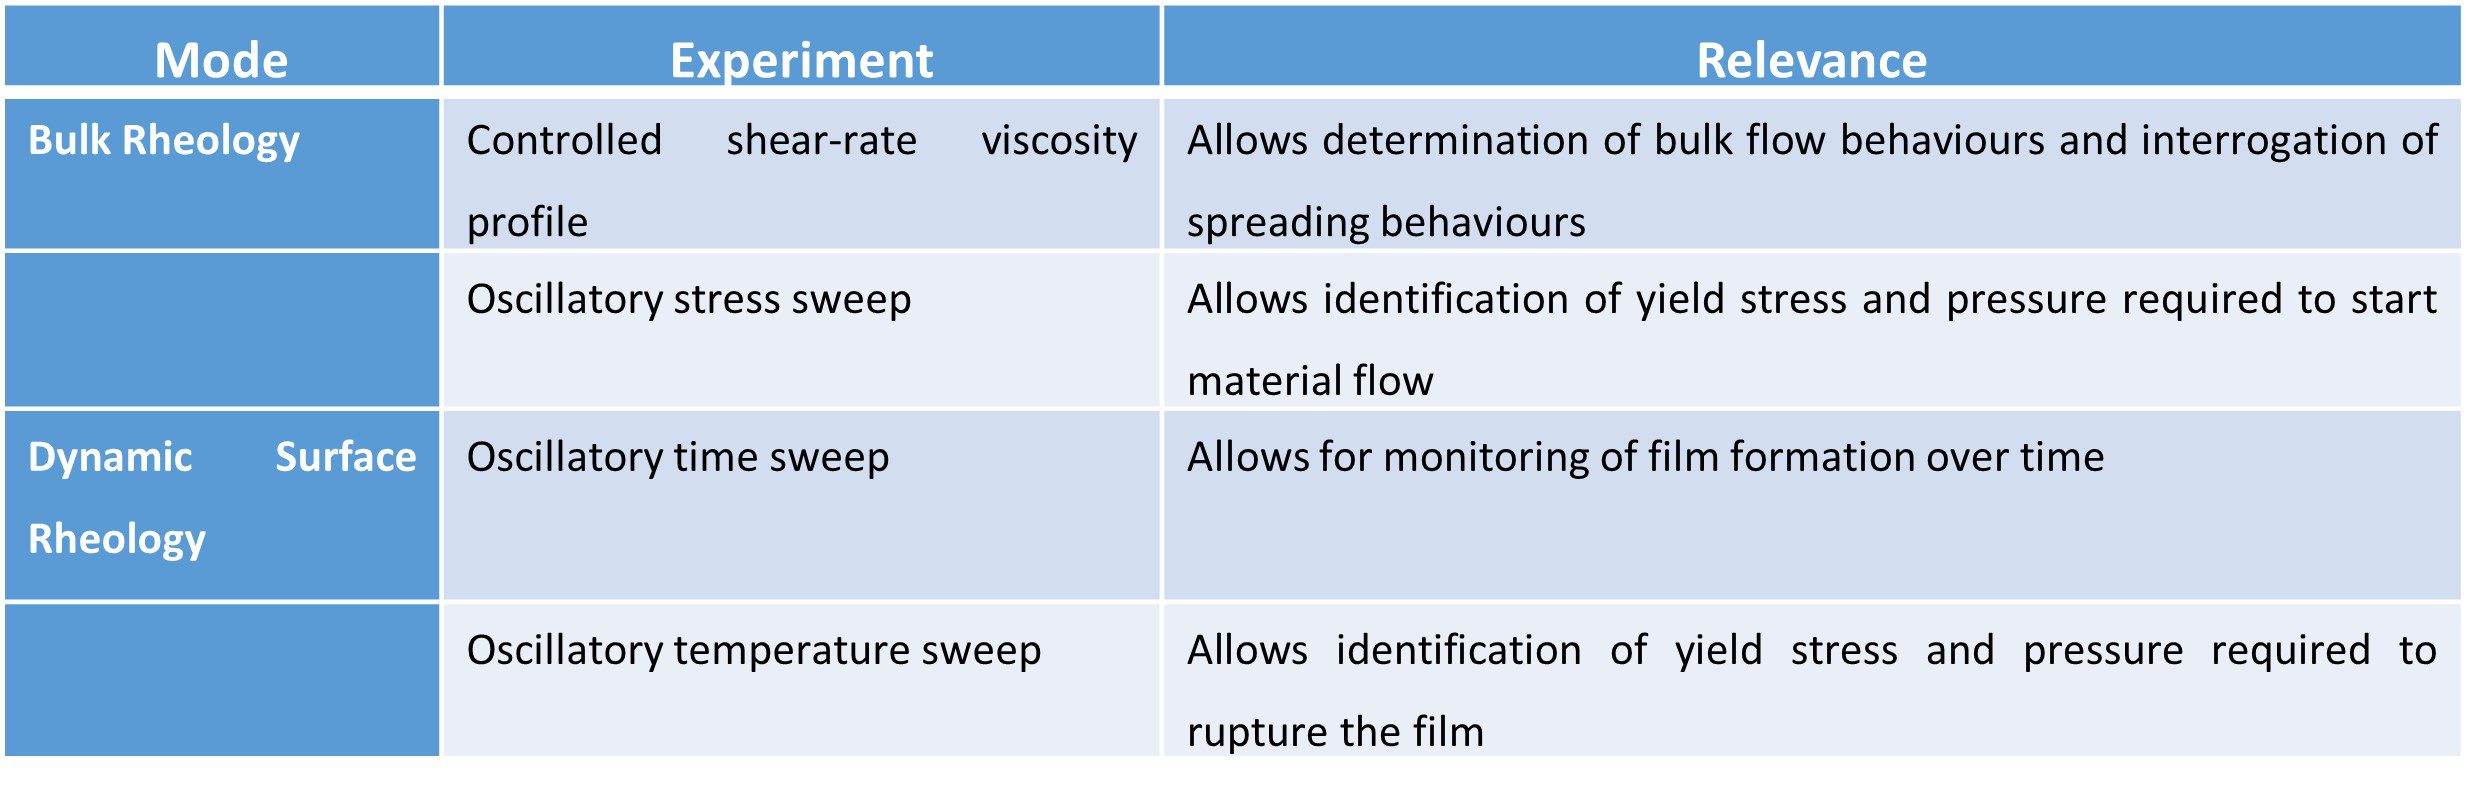
Bulk rheology and dynamic surface rheometry can offer different, yet complementary, data. The experiments used in this study and what they showed are outlined in the table below:
For further information about rheology paints, or for a more general discussion about rheology and how it could be helpful to your project, please get in touch.