 Ensuring even seasoning distribution on snack products, such as crisps, presents a significant industry challenge. Uneven seasoning distribution can lead to inconsistent consumer experiences and affect overall product quality.
Understanding powder flow dynamics poses a way to address this challenge, as the flowability of seasoning powders provides insights into how they may perform during a snack coating process.
Introduction to Dynamic Powder Flow Characterisation
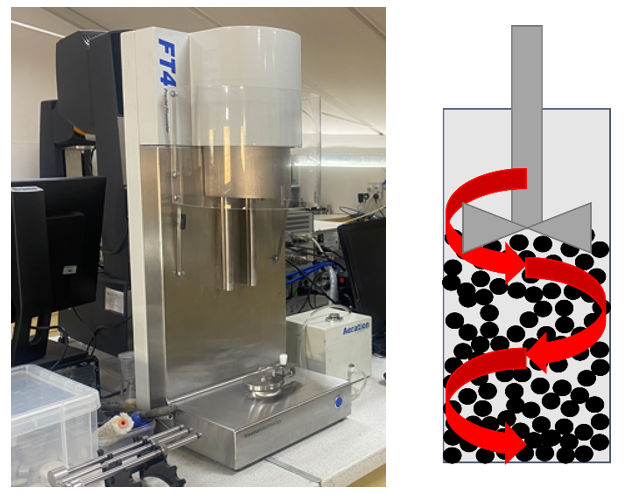
Dynamic powder flow measurements are an excellent technique for characterising the flowability of seasonings. They involve using an impeller that rotates and moves vertically through the powder sample, creating a controlled flow pattern. The instrument records both torque and force, providing a combined measure of resistance.
Several key metrics are derived from this test:
- Basic Flowability Energy: Represents the powder’s overall resistance to flow. Higher total flow energy typically indicates increased cohesion, which translates to powders that may be more challenging to coat uniformly. The basic flowability energy is quoted as the total flowability energy of the 7th test.
- Specific Energy: Specific energy is measured as a blade moves upward in a helical path, gently lifting and dropping the powder. The low stresses inherent with this measurement are sensitive to particle shape, texture, and cohesion. Higher values reflect finer particles or greater cohesion.
Contact us to discuss the characterisation of your powders
Dynamic Powder Flow Measurements for Seasonings
Four different seasoning samples were chosen to characterise and benchmark their behaviours. Through this, we can identify which ones may be most suitable for coating processes, while also identifying seasonings that may pose problems with uneven seasoning distribution. Each seasoning was subjected to dynamic powder flow measurements at a tip speed of 100 mm/s.
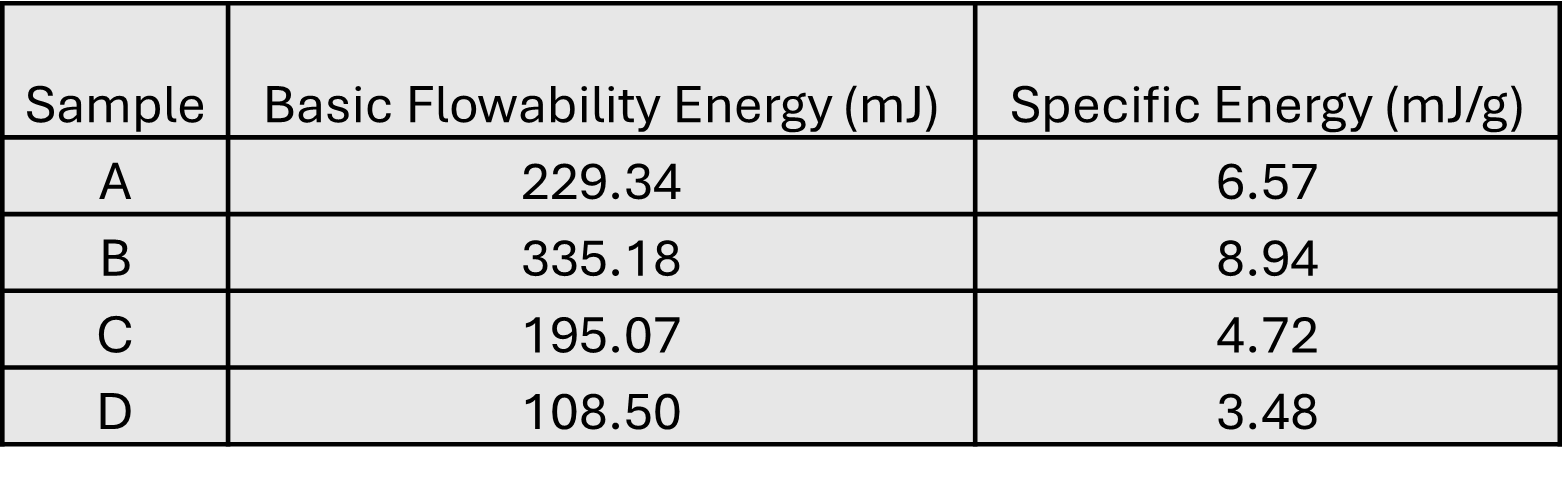
Notable variations were observed with this sample set. The basic flowability energy ranged significantly from 108.5 mJ for sample D to 335.18 mJ for sample B. Such variation suggests that sample B, with its much greater basic flowability energy, may exhibit higher cohesion. In addition to this, the specific energy similarly exhibited considerable differences, from as low as 3.48 mJ/g for sample D, to as high as 8.94 mJ/g for powder B. The higher value again for sample B suggests higher cohesion or finer particles.
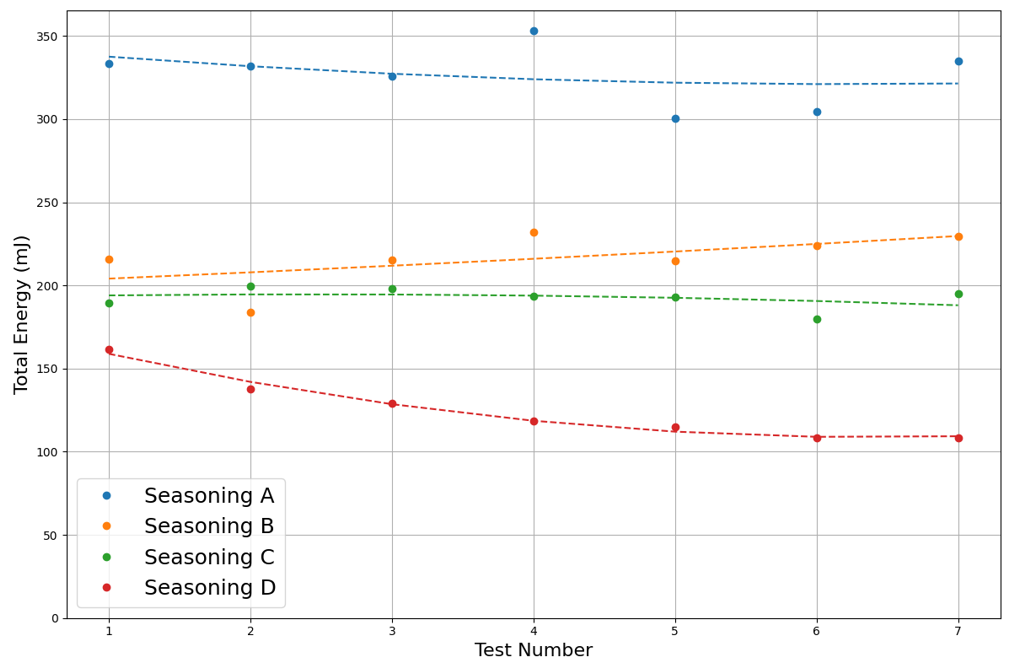
From both basic flowability energy and specific energy, it has been identified that sample B may pose the most significant challenges in achieving even distribution on snack surfaces, compared to the other samples tested. In addition to this, Figure 3 highlights variability in total energy values recorded across each test run. This variability can serve as an indicator of stability, with samples that display more closely related total energy values suggesting greater stability.
Summary
Overall, the data highlights differences in powder flow properties among different seasoning types. Snack manufacturers can significantly benefit from powder characterisation to ensure optimised seasoning selection and improved consistency in snack coating processes, enhancing both product quality and consumer satisfaction.
At the Centre for Industrial Rheology, we have a controlled humidity chamber and regularly perform caking studies, as well as investigations into the effects of humidity on powder behaviour. If you would like to discuss further about how we can support your seasoning characterisation needs, do not hesitate to contact us.

Related Articles;
Crisp and Clear – Benchmarking Crispiness Through Acoustic Analysis
The Impact of Humidity on Seasoning Powder Flowability in Global Processing
Same Humidity, Different Flow – Hygroscopicity of Seasoning Powders
Wasif Altaf serves as an Applications Specialist at the Centre for Industrial Rheology, leveraging a chemical engineering background (BEng) to bridge theory and practice. His work focuses on advanced rheological characterisation.