Supporting a wide range of industries, we provide high-precision testing for materials across a wide range of temperatures. From Dynamic and Kinematic Viscosity, to Density, Surface Tension, and Thermal Conductivity – including Specific Heat Capacity and Zeta Potential – we handle all types of testing. Whether you require data for formulation development, quality control, or technical data sheets, we offer a rapid turnaround with minimal sample volume requirements. We can also provide raw data tabulation for all measurements conducted.
| Metric | Temperature Range (°C) | Brief Description |
|---|---|---|
| Dynamic Viscosity (Pa·s, cP) | -45 to 500 | Measures a fluid’s internal resistance to flow |
| Kinematic Viscosity (m²/s, cSt) | 0 to 100 | The ratio of dynamic viscosity to density, a measure of a fluid’s resistance to flow under gravity |
| Density (g/cm³, SG, SG t/4) | 0 to 100* | An absolute measurement of mass per unit volume |
| Surface Tension (mN/m) | 0 to 120 | Measures the cohesive forces at a liquid-gas interface |
| Thermal Conductivity (W/(m·K)) (Including Diffusivity and Effusivity) | -25 to 200 | Quantifies the rate at which heat passes through a material |
| Specific Heat Capacity (J/kg·K) | -90 to 550 | The energy required to increase the temperature of a material of one unit of mass by one unit of temperature |
| Zeta Potential (mV) | 0 to 70 | Indicates the magnitude of electrostatic repulsion between particles |
* Extrapolation is available for temperature ranges outside the direct measurement limits, provided the material remains phase-stable | ||
Book a chat with our team to discuss how we can characterise your products across a wide range of temperatures
Contact Us
This article goes into these metrics and how they are captured in more detail, with some examples of how data collected can be presented.
Dynamic Viscosity
Dynamic viscosity is the measure of a fluid’s internal resistance to flow and has units of Pa·s, cP. There is generally a strong temperature dependence on viscosity, with many samples experiencing a significant drop in viscosity as temperature rises. As thermal energy increases, molecules can more easily overcome the intermolecular interactions that inhibit their movement. As such, molecular mobility increases, allowing fluid layers to flow past each other more easily, resulting in a reduction in viscosity.
Understanding this relationship is important for understanding processability. A formulation that possesses high viscosity at room temperature may transition to low viscosity at processing temperatures. If you are designing equipment such as pumps, it is essential to understand exactly how the fluid behaves at specific operating temperature ranges. We can characterise the complete thermal profile of your product to ensure it behaves as desired.
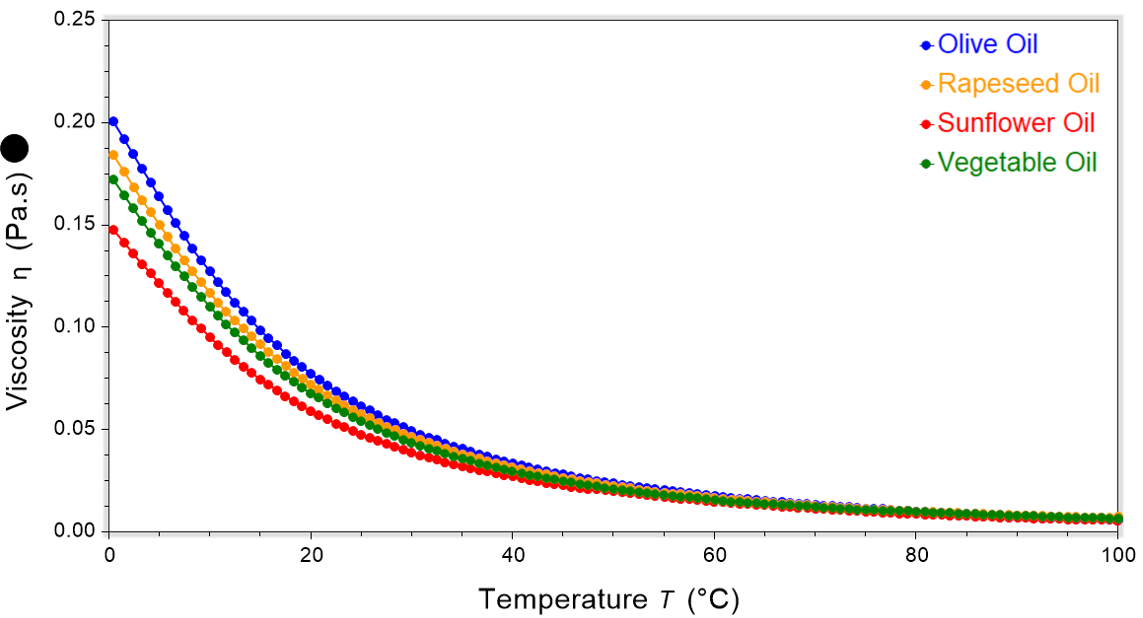
In Figure 1, the viscosity of varying cooking oils was shown to decrease significantly upon heating. Although the initial viscosity values differed slightly at 0 °C, at higher temperatures, they exhibited very similar viscosities.
Kinematic Viscosity
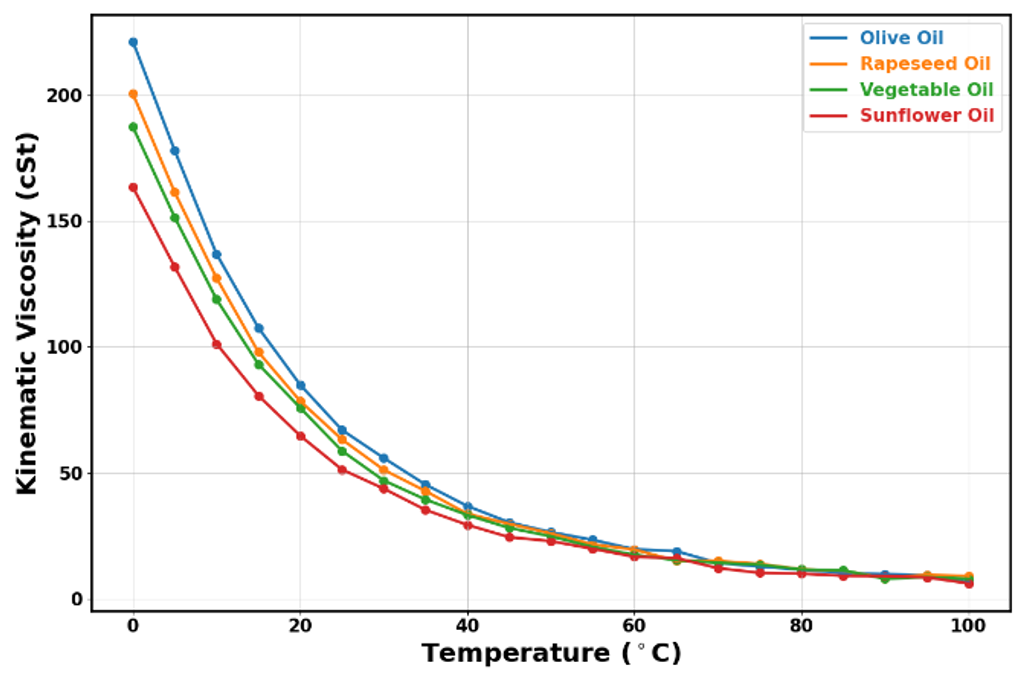
Kinematic viscosity represents the ratio of dynamic viscosity to a fluid’s density and has units of m²/s or cSt. While dynamic viscosity measures internal friction, kinematic viscosity provides insight into how quickly a fluid flows under the influence of gravity. This metric is especially useful when comparing fluids under similar conditions and predicting how they will behave in practical applications.
We deliver highly reliable kinematic viscosity values by calculating the ratio of measured dynamic viscosity to measured density. This method is very similar to that taken with the Stabinger Viscometer (ASTM D4052, DIN 51659). However, our approach also allows us to address the complexities of any non-Newtonian behaviour observed in the fluids tested and maintains robust temperature control for high-quality measurements.
Density
Density is defined as the ratio of a material’s mass to the volume it occupies and has units of g/cm³ or kg/m³. It represents the concentration of mass within a given space. Density typically decreases linearly with increasing temperature due to thermal expansion. As a fluid’s temperature increases, its molecules gain kinetic energy and move further apart, leading to an expansion in volume. Since the mass of the fluid remains constant, density increases.
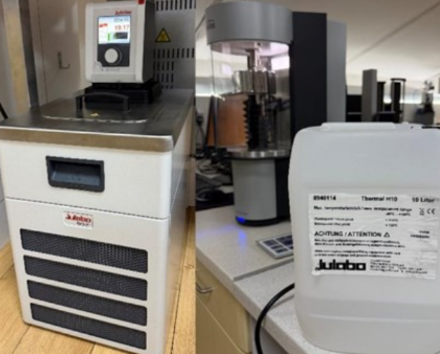
We utilise a dedicated density meter with built-in temperature control for high-precision characterisation. This integrated system allows for temperature-controlled measurements to be performed across a range of 0 – 100 °C. The technique employs the pulsed excitation method, compliant with internationally recognised standards including ASTM (D4052, D5002), DIN (51757), and ISO (2811-3, 12185) and pharmacopoeia standards including Ph. Eur. 2.2.5 and USP 841. Measurements are reported up to five decimal places in a comprehensive selection of units, including g/cm³, kg/m³, and Specific Gravity (SG) – including SG t/4, the ratio of the sample density to that of water at 4°C.
While our direct measurement range covers 0 – 100 °C, the generally linear relationship between density and temperature allows us to extrapolate data beyond these limits. However, extrapolation only remains accurate if the fluid does not undergo any phase changes or major transformations such as crystallisation or degradation within the extended temperature range.
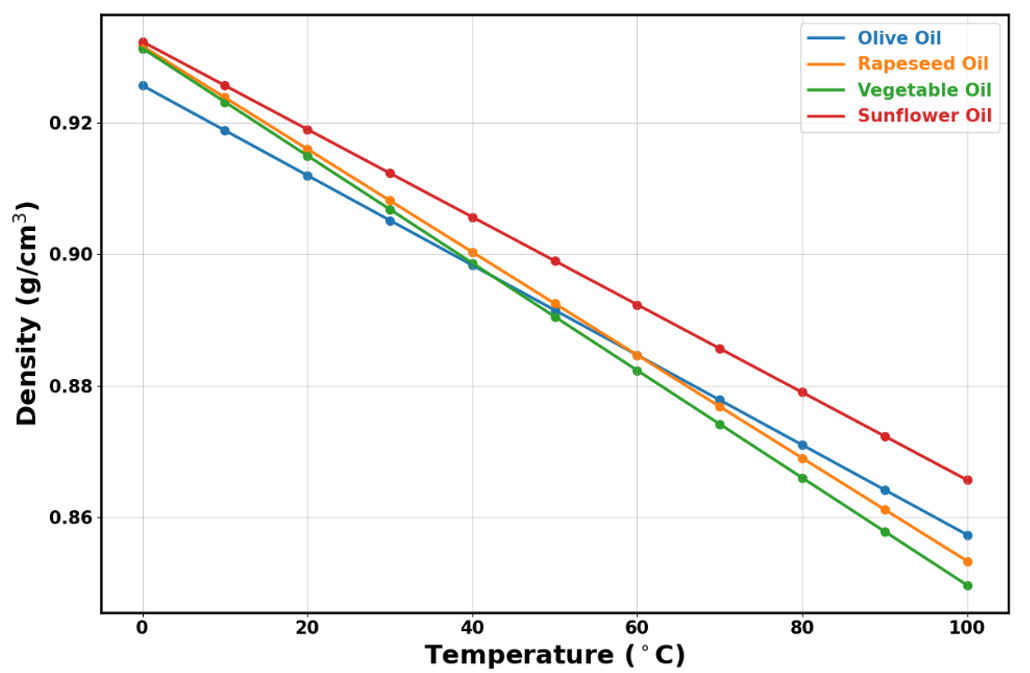
The density for all oil samples tested exhibited a strong linear decrease with increasing temperature. The density values were closely clustered, starting just above 0.92 g/cm3 at 0 °C and decreasing to approximately 0.85 g/cm3 at 100 °C.
Surface Tension

Surface tension is measured in units of mN/m, with surface tension and temperature sharing an inverse relationship; as temperature increases, surface tension decreases. When a liquid is heated, its molecules gain kinetic energy and begin to move more vigorously. This increased kinetic energy directly counteracts the cohesive forces holding the liquid together. With molecules in more rapid motion, the intermolecular attractions are less effective, which in turn weakens the net inward pull experienced by the molecules at the surface. As a result, the tension at the liquid’s interface is reduced, and surface tension drops.
We measure surface tension accurately across a wide temperature range using Bubble Pressure Tensiometry. This method works by recording the maximum pressure required to form a bubble at the tip of a submerged capillary. A distinct advantage of this technique is its use of an enclosed sample vessel, which provides a stable thermal environment. In contrast, optical methods generally feature an open design, making precise temperature control challenging.
The data obtained from this method can be reported in different formats depending on the analytical requirements. It can be presented as a single equilibrated value or provided as a full dynamic surface tension curve. The latter is particularly useful in assessing the effects of temperature on surfactant kinetics.
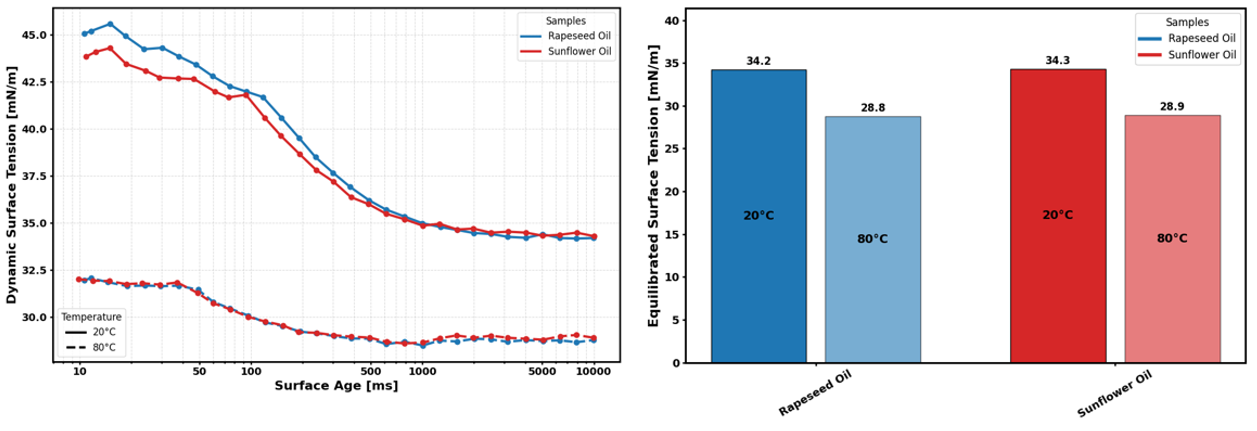
At 20 °C, both samples achieve a reduction in surface tension of roughly 10 mN/m by the time they reach a surface age of 1000ms. Increasing the temperature to 80 °C results in a significantly lower initial surface tension. At this elevated temperature, the surface tension reduction is far less pronounced, with a reduction of around 3 mN/m over the same period. Comparison of equilibrated values offers a single, straightforward metric for comparing temperature effects on surface tension, independent of surfactant kinetics, with values of 34.2 mN/m at 20 °C for rapeseed oil and 28.8 mN/m at 80 °C.
Thermal Conductivity
Thermal conductivity is measured in units of W/m·K, and quantifies the rate at which heat passes through a material. It describes the ease with which thermal energy flows across a temperature gradient. A material with high thermal conductivity can dissipate vast amounts of heat quickly across a large distance, which is desirable for heat sinks and thermal interface materials. Conversely, a material with low thermal conductivity acts as an insulating barrier to heat.
For applications involving heat transfer, such as cooling systems in data centres or thermal management in electric vehicles, understanding the relationship between thermal conductivity and temperature is essential. As operating temperatures rise or fall, the efficiency of heat transfer may change. By mapping thermal conductivity across a range of -25°C to 200°C, we ensure that you are able to predict performance under real-world thermal conditions.
We utilise the transient plane source approach to measure thermal conductivity, diffusivity, and effusivity. For solid sheet samples, a standard transient plane source is used where the sensor is sandwiched between two sample layers. For liquids, pastes, and powders, we use a modified transient plane source, where the sample sits on top of the sensor.
Zeta Potential
Zeta potential is measured in mV. The magnitude of zeta potential is a direct indication of the electrostatic repulsive forces around a particle and is a primary indicator for the stability of suspensions and emulsions. 
- > 30 mV (Stable) – Generally, a zeta potential with a magnitude greater than 30 mV, either positive or negative, indicates good stability. The electrostatic charge is sufficient to repel neighbouring particles, preventing them from approaching close enough to aggregate.
- < 30 mV (Unstable) – When the magnitude drops below 30 mV, the repulsive barrier is weak. Over time, Brownian motion will lead to particles colliding, resulting in flocculation or coalescence.
While a formulation may exhibit robust stability at room temperature, differing temperatures can alter the electrical double layer surrounding particles. By profiling the temperature dependency of zeta potential across a range of 0°C to 120°C, we can rigorously assess thermal stability. This ensures that your suspension or emulsion remains stable not just at room temperature, but throughout the temperature conditions it is expected to endure.
Contact us to explore how we can characterise your materials across a wide range of temperatures

Related Articles;
Predicting Formulation Stability: Advanced Insights for Suspensions and Emulsions
Wasif Altaf serves as an Applications Specialist at the Centre for Industrial Rheology, leveraging a chemical engineering background (BEng) to bridge theory and practice. His work focuses on advanced rheological characterisation.