 At the Centre for Industrial Rheology, we can carry out rapid characterisation to understand how differing climatic conditions may impact powder flowability.
Processing powders such as seasonings under varying global climates remains a persistent challenge for food manufacturers due to variations in relative humidity. Humidity can significantly influence moisture uptake, leading to powders joining together as a cohesive mass. This can cause equipment blockages, product waste, and uneven seasoning distribution.
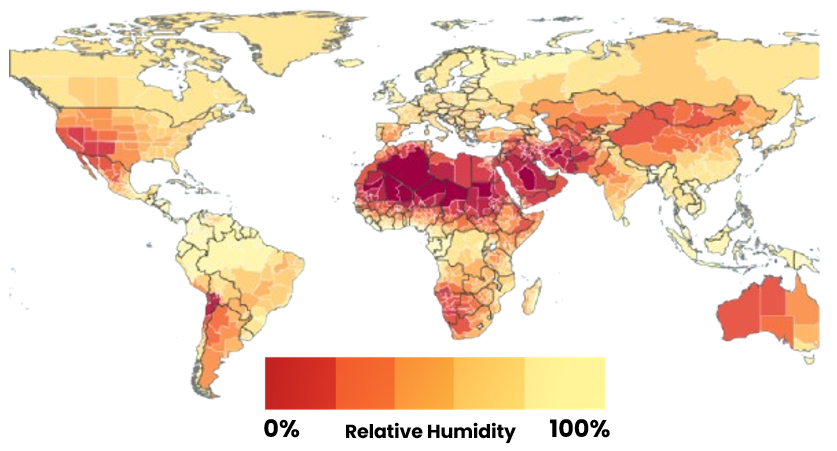
We conducted controlled humidity conditioning of a seasoning powder in our climatic chamber, intended to simulate three different environments:
- 20% Relative Humidity – representing dry, arid climates such as Arizona
- 50% Relative Humidity – representing moderate conditions typically found in Central Europe
- 80% Relative Humidity – representing tropical, high-humidity climates such as Malaysia
Contact us to arrange a discussion on powder measurements with our experts
Mechanisms Behind Humidity Effects on Powder Flowability
Powder flowability can be significantly affected by relative humidity. The intrinsic ability to absorb moisture from the air for a powder is known as hygroscopicity. Not all powders are equally hygroscopic; some can remain relatively dry even at high relative humidity, while others begin to absorb water at much lower humidity levels. If a powder is highly hygroscopic, the absorbed moisture can condense at contact points between powders, forming thin liquid menisci. These menisci generate capillary forces, which act to pull the particles together, creating liquid capillary bridges.
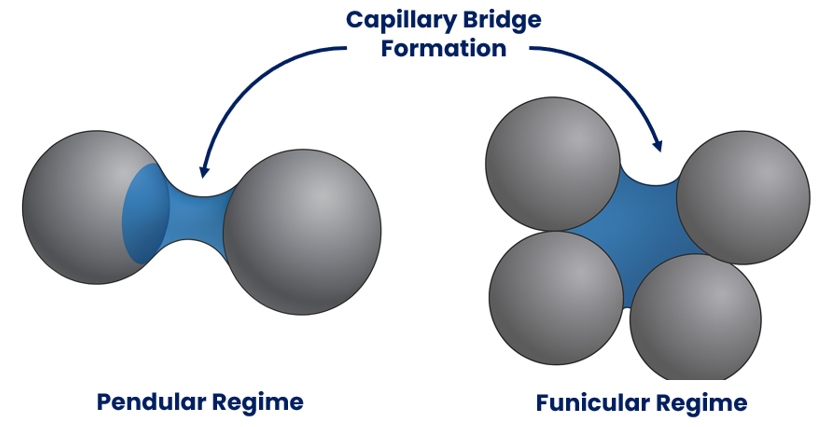
The presence of these capillary bridges increases particle adhesion, making powders more prone to agglomeration and reducing flowability. As humidity increases, these liquid bridges strengthen, and the system can enter the funicular regime. In this regime, individual capillary bridges begin to merge into larger clusters, forming a single liquid network that connects multiple particles.
Characterising Powder Flow with Controlled Humidity Conditioning
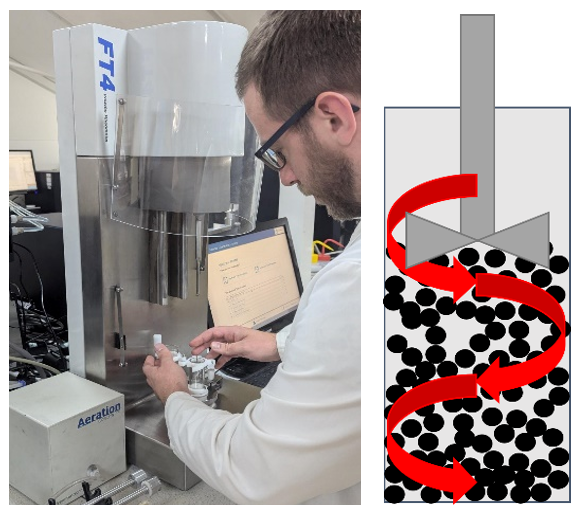
To quantify powder flowability, we utilised dynamic powder flow measurements. These involve using an impeller that rotates and moves vertically through the powder sample, creating a controlled flow pattern. The instrument records both torque and force, providing a combined measure of resistance. The resistance is expressed as total energy, with higher values reflecting greater resistance to flow. This is a highly sensitive method that can detect subtle changes in powder behaviour that basic tests, such as the angle of repose, may miss.
Samples were conditioned in our climatic chamber to undergo controlled humidity ageing. Before being subjected to environmental conditioning, all samples underwent an initial mechanical conditioning step in which the impeller was passed through the powder to break up any present agglomerates or caking.

Preconditioned samples followed the same mechanical conditioning procedure; however, they were not exposed to environmental conditioning. All samples were then subsequently tested at a tip speed of 100 mm/s.
Powder Flowability Results Under Differing Humidity Conditions
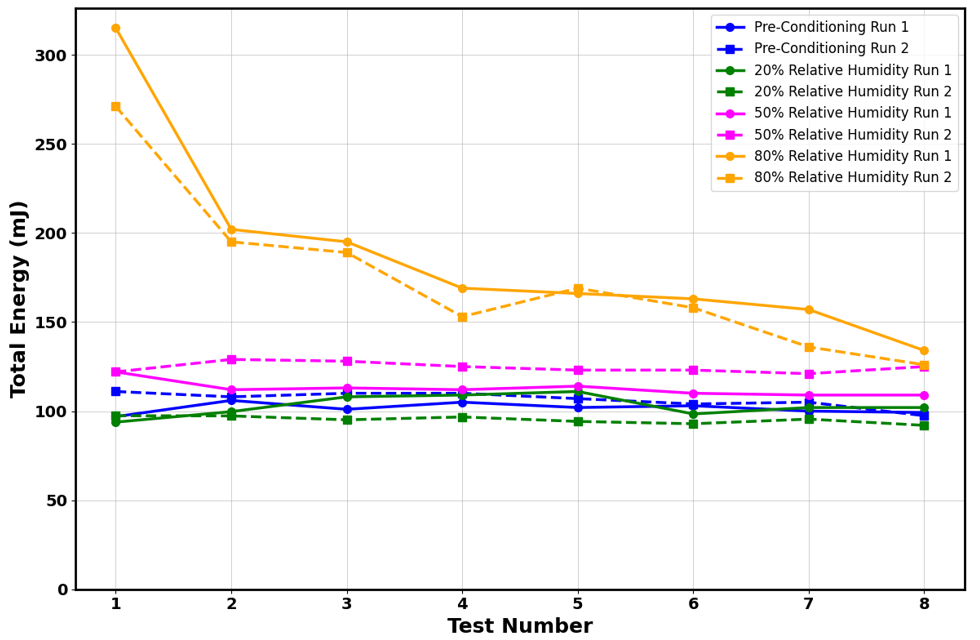
The results show clear differences in flowability between powders that have been subjected to differing humidity conditions.
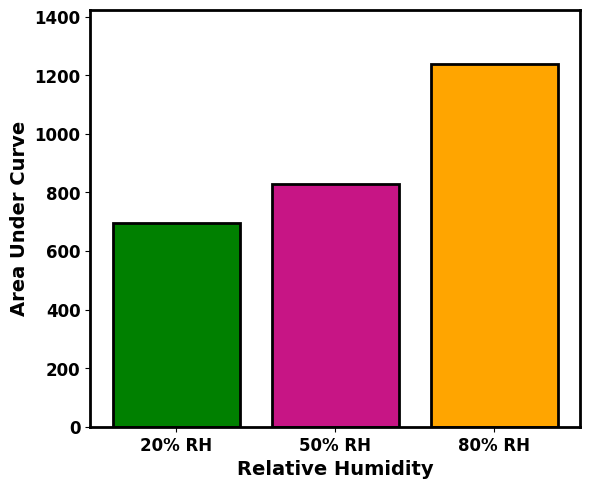
Figure 6 highlights these differences further. A larger area under the curve indicates that more energy was required for the powder to flow, reflecting reduced flowability.
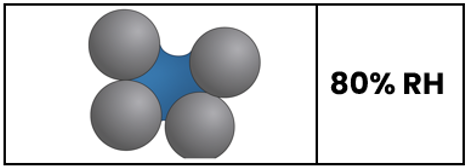 The 80% relative humidity sample showed the highest total energy values across the samples tested. This elevated humidity results in the formation of liquid capillary bridges, resulting in greater resistance to flow. This effect is clearly reflected in the elevated total energy values for this sample.
Interestingly, the first few runs highlight a pronounced increase in total energy, suggesting the presence of caking. Although further tests reduced the total energy, the values remained consistently higher than those of lower humidity. This reflects the strengthening effect of capillary bridges, which may have entered the funicular regime.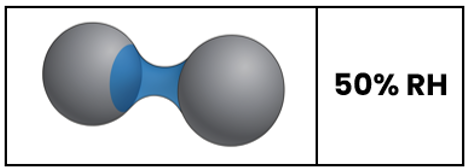
Even at a moderate relative humidity of 50%, measurable increases in total energy were observed. This indicates reduced powder flowability due to the formation of capillary bridges.
In contrast, the 20% relative humidity sample generally recorded the lowest total energy values out of the samples tested. This suggests improved flowability, with the energy reduction likely due to the removal of moisture, as lower relative humidity causes drying. This highlights that mild drying can enhance flowability in powders that may otherwise be moderately hygroscopic.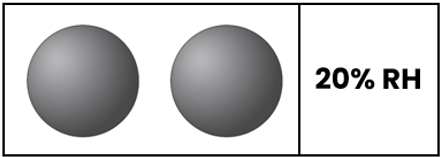
From a practical perspective, these findings emphasise the sensitivity of seasoning powders to even moderate humidity changes. In climates with higher ambient relative humidity, flow aids or enhanced agitation may be required to maintain process efficiency and prevent blockages. In addition to this, controlled drying to low humidity levels could be an effective way of improving flow without the use of chemical additives. The practical implementation of these solutions will depend on the cost and feasibility of maintaining such conditions during processing.
Summary
This study demonstrates our extensive capabilities in conducting a comprehensive analysis of the effects of relative humidity on powder flow. These in-depth investigations can be crucial for manufacturers operating globally, where variations in climate can significantly impact powder processing. While this study focused on powders in isolation, we can also conduct environmental conditioning with products in their packaging to evaluate how effectively packaging choices maintain storage stability.
By thoroughly characterising powders subjected to differing humidity conditions, manufacturers can anticipate climate-related challenges and adapt processing conditions to support more consistent and reliable powder processing. This allows tailoring of processes not only to diverse geographical climates but also to seasonal changes.
References
[1] – Global Data Lab. Yearly average relative humidity (%) 2022 [Internet]. [cited 2025-Aug-20]. Available from: https://globaldatalab.org/geos/maps/relhumidityyear/2022/?levels=4

Related Articles;
Flow to Flavour: Dynamic Powder Analysis for Optimising Seasoning Coating
Same Humidity, Different Flow – Hygroscopicity of Seasoning Powders
Wasif Altaf serves as an Applications Specialist at the Centre for Industrial Rheology, leveraging a chemical engineering background (BEng) to bridge theory and practice. His work focuses on advanced rheological characterisation.
