Using dynamic foam analysis methods, we determined important properties of shampoo foams such as drainage, height, volume, and bubble size, all of which are direct indicators of foam (in)stability. We also captured time-resolved images of the foams, allowing for analysis of their structure both via image and bubble size distribution histograms. Consumer perception of a shampoo’s efficacy is often directly linked to how well it lathers, and as suc,h this work will be of direct interest to haircare industry professionals, formulation scientists, and hair/body care experts. This work is also relevant to those in the detergent industry and anyone dealing with surfactants where foaming (or lack of) is an important characteristic in general.
Shampoo formulation
Whilst hair washing is now a regular part of our daily routines, shampoo as we know it has only existed for under a century, with Schwarzkopf debuting liquid shampoo in Germany in 1927. Synthetic surfactants were first used in the 1930s, and silicones were suspended in shampoo successfully in the 1980s, meaning shampoo could also condition hair. Further developments followed leading to the haircare market we know today, which ranges from cheap, basic cleansers, to expensive, luxury formulations which nourish and condition hair.
At its most rudimentary, a shampoo should lather well, remove oil and dirt, be easily rinsed, and leave hair feeling soft and manageable. Luxury shampoos often contain active ingredients which provide additional functions such as repairing or smoothing hair, and vitamins to help nourish hair. A rich lather with a pleasant creaminess helps a shampoo feel more luxurious and as such, how a shampoo foams is critical to its success.
This study investigated the foaming behaviour of two shampoos, a market leader and a supermarket’s own brand, comparing them at two concentrations.
For further information about these tests or the range of tests that we offer, please contact our experts today
Interfacial properties for foaming
For a liquid to produce foam, it requires the presence of a surfactant to reduce the surface tension between the liquid and gas in order to form a gas-liquid interface. Surfactants lower the surface tension by adsorbing onto the gas-liquid interface and decreasing the work needed to increase the surface area.
Shampoos are formulations typically consisting of primary surfactants (for cleaning), secondary surfactants (to improve foaming), foam stabilisers, thickeners, fragrances, and water. It is often the secondary surfactants and foam stabilisers which are key to the creation of a ‘creamy’, stable lather.
Foams are inherently thermodynamically unstable as a result of their high interfacial free energy. Foam decay caused by a decrease in the interfacial free energy can be explained by many often-conflicting mechanisms and theories beyond the scope of this study. From these mechanisms, we can, however, identify key parameters which can be measured indicating foam (in)stability such as:
- Drainage half-life, an indication of foam drainage (flow of liquid through a foam under gravity)
- Mean bubble size, an indication of ripening/coalescence
Whilst shampoo lather is only required to be stable for the minute or two it is in use, the structure and stability of the foam is key for customer perception of the product.
Shampoo foamability – making the foam

In this study, the foaming characteristics of two shampoos were compared:
- Shampoo A; a market-leading shampoo brand
- Shampoo B; is a supermarket’s own-brand
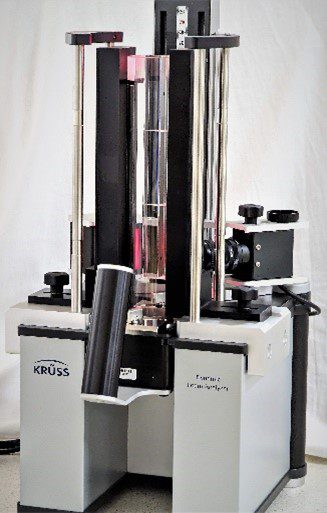
Each shampoo was diluted to two concentrations, 1:10 and 1:100 w/w with deionised water, in order to explore the effects of dilution. 50 ml of sample was added to the Dynamic Foam Analyser and sparged using a porosity grade 3 (16-40 μm pores) sintered disc filter for 30 seconds at 0.3 L min-1.
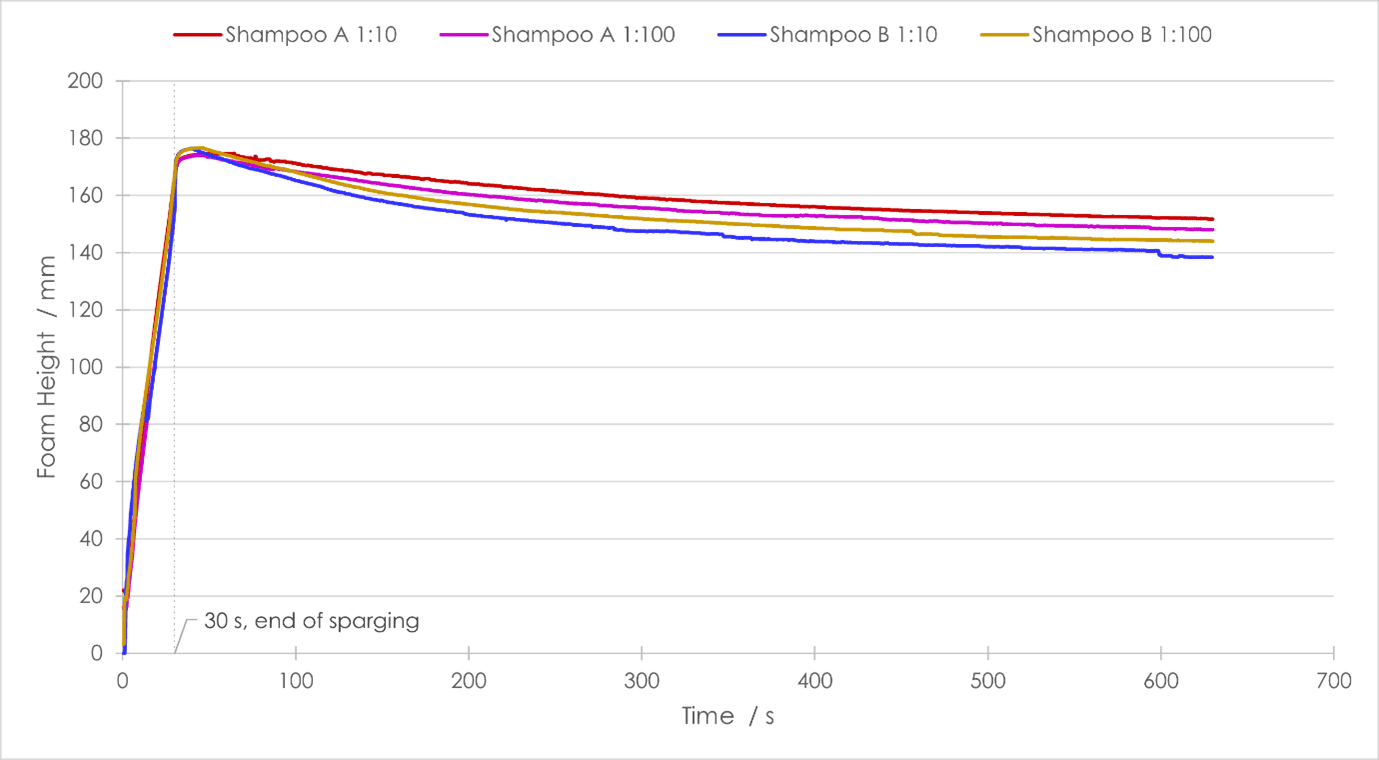
The foamability of a substance is its propensity to foam and is most simply characterised by the volume of foam formed from a given quantity of material. For the purposes of this study, we compared foam height in the glass column in lieu of volume, which is directly proportional to foam volume.
After sparging, all samples produced a roughly similar height of foam. Both concentrations of Shampoo A afforded slightly less foam than those of Shampoo B, with maximum foam heights of ~174 mm and ~176 mm respectively. For both shampoos, dilution had little effect on their foamability, with differences of ~0.5 mm between the two concentrations.
A further study may investigate how volume of foam produced differs between samples with a set volume of gas sparged through the mother liquor, or times to reach a certain foam height given a set flow rate.
Shampoo foam stability
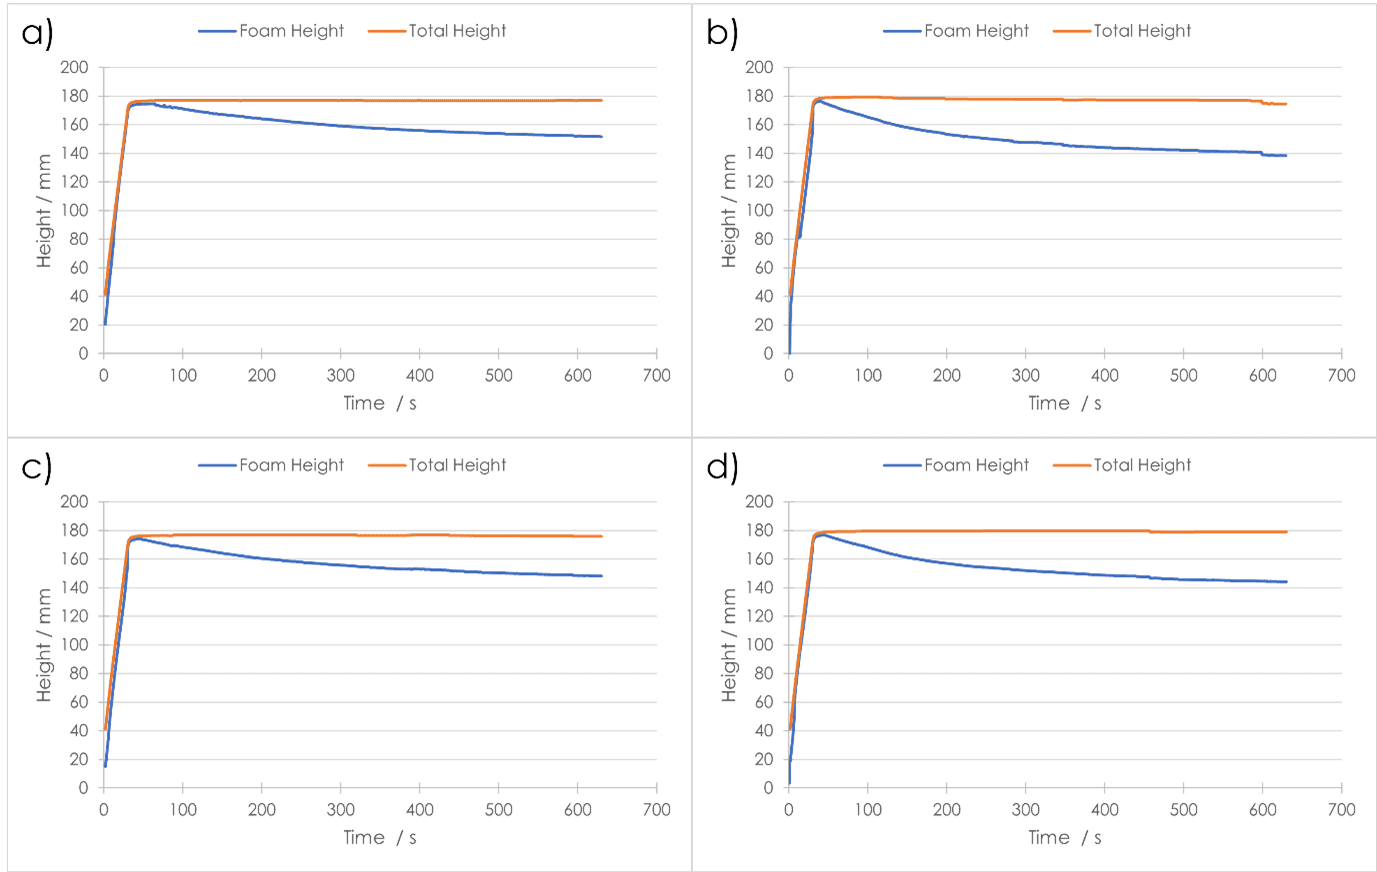
A foam’s stability can be defined as the time that the foam maintains its initial properties as generated. Once a substance has ceased foaming (sparging/agitation has ended), its stability can be measured via a variety of methods. One such method expresses stability in terms of the half-life of a foam, which is the time at which half of the volume of liquid contained in the foam has reverted to the bulk-liquid phase. A shorter half-life indicates a less‑stable foam.
Video 1 : Time lapse of foam formation and decay
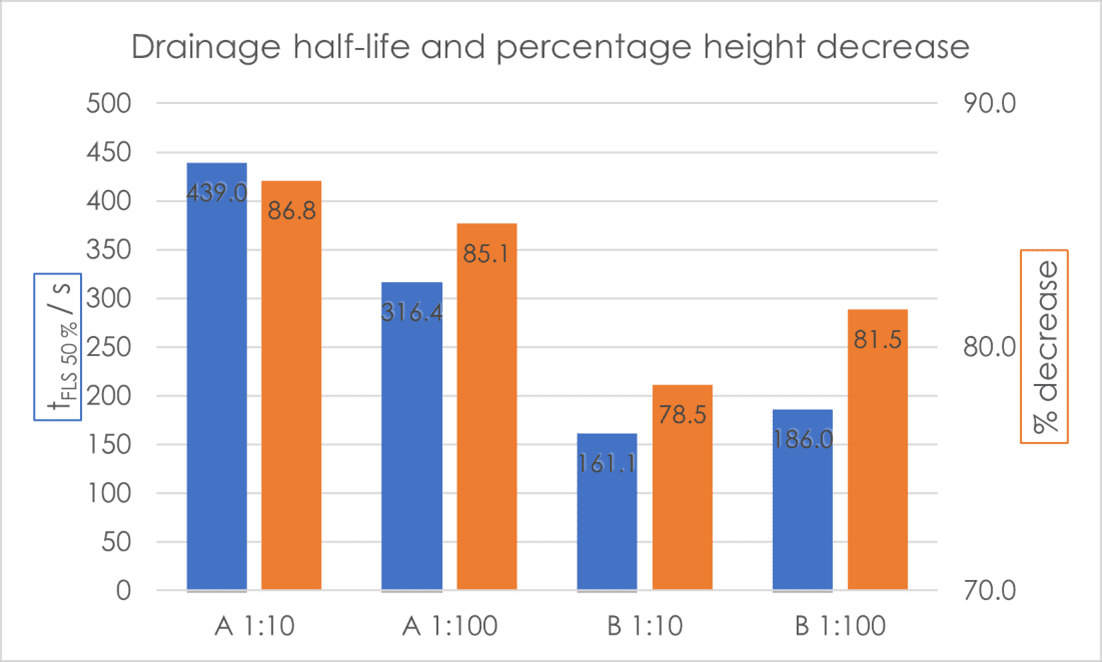
As regards half-life, Shampoo A produced a foam more stable than Shampoo B at both concentrations. The drainage half‑life of both foams from Shampoo A were almost double those of Shampoo B [Fig. 3]. What is interesting to note is that Shampoo B produced a more stable foam when more dilute (1:100 w/w concentration), whereas for Shampoo A the opposite was true. The same trends can be seen in the percentage decrease in foam height. After 600 seconds of foam decay, the four final foam heights showed clear differentiation, and again followed the trend of drainage half-life, with Shampoo A at 1:10 w/w concentration having the greatest remaining foam height, and Shampoo B at 1:10 w/w concentration having the lowest.
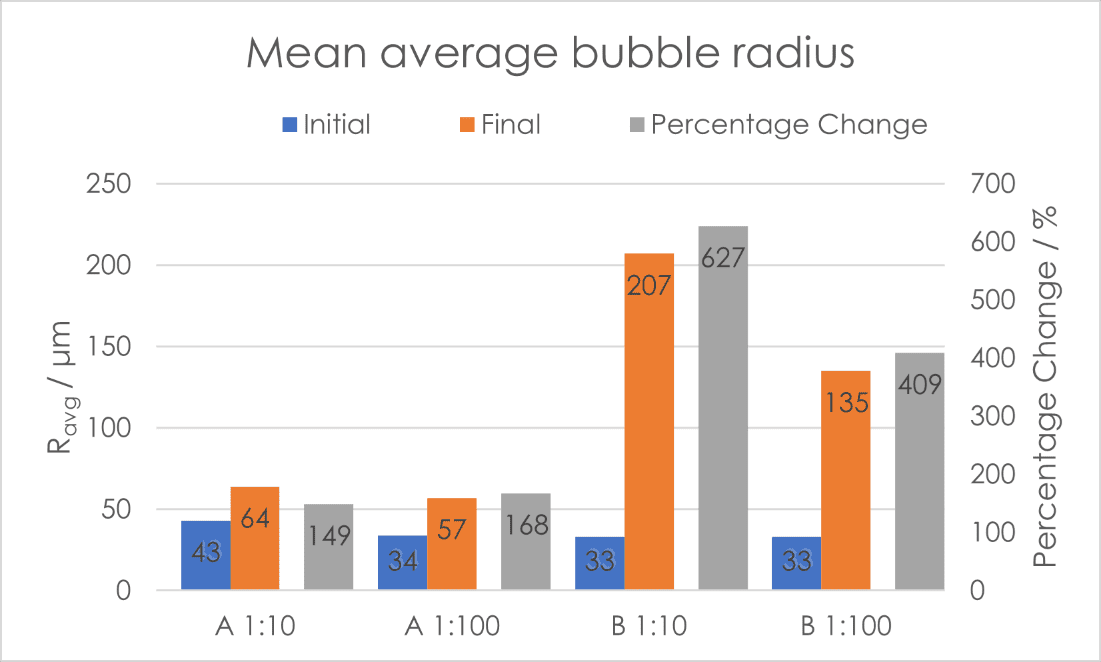
Another good indicator of foam instability is the propensity of the bubbles contained within it to increase in size. This can be due to a variety of factors, such as disproportionation, or Ostwald ripening, and coalescence due to lamellae between foam bubbles rupturing. To this end, we compared the Ravg (mean average bubble radius) at tstab (20 seconds after end of sparging, when no more influence of foaming dynamics on structure is expected) and at the end of the measurement period [Fig. 4]. There is clear differentiation between the two shampoos, and also between the concentrations of the mother liquor. Shampoo A showed greater stability with regard to Ravg, with only a slight increase in average bubble size compared with Shampoo B. The percentage change of Ravg follows the same stability trend seen for drainage and foam height.
Shampoo foam structure as a function of time
The effects of drainage and bubble size growth have a marked influence on the structure of a foam. The foam analyser allows for the structure to be captured visually to determine the bubble size distribution with respect to time.
When observing the foam decay in real time, it was clear from sight alone that Shampoo A produced a more stable foam than Shampoo B at both concentrations. By using the structure module on the DFA100 and KRÜSS Advance software, coloured histograms were produced [Fig.s 5 & 6] showing bubble size distributions for the two shampoos at 1:10 w/w concentration. The histogram colours correspond with bubble size, allowing time resolved comparison of the bubble structure.
Video 2: Recording of foam decay (speed x 5000)
For a fair comparison of the foam structures, the histograms had an x-axis range of 0 μm to roughly double the mean bubble area at tfinal, split into 50 bins of equal size. The y-axis bounds changed depending on highest bubble count at the time stamp, meaning the graphs are more of a visual proportional comparison of the structure evolution than absolute one. The largest bubbles are not included in the histograms, seen in white in the foam images.
Initially, the foam from Shampoo A had a very high proportion of the smallest bubbles compared to the rest [Fig. 5]. Over time, the amount of the smallest bubbles decreased relative to the rest, which increased fairly uniformly.
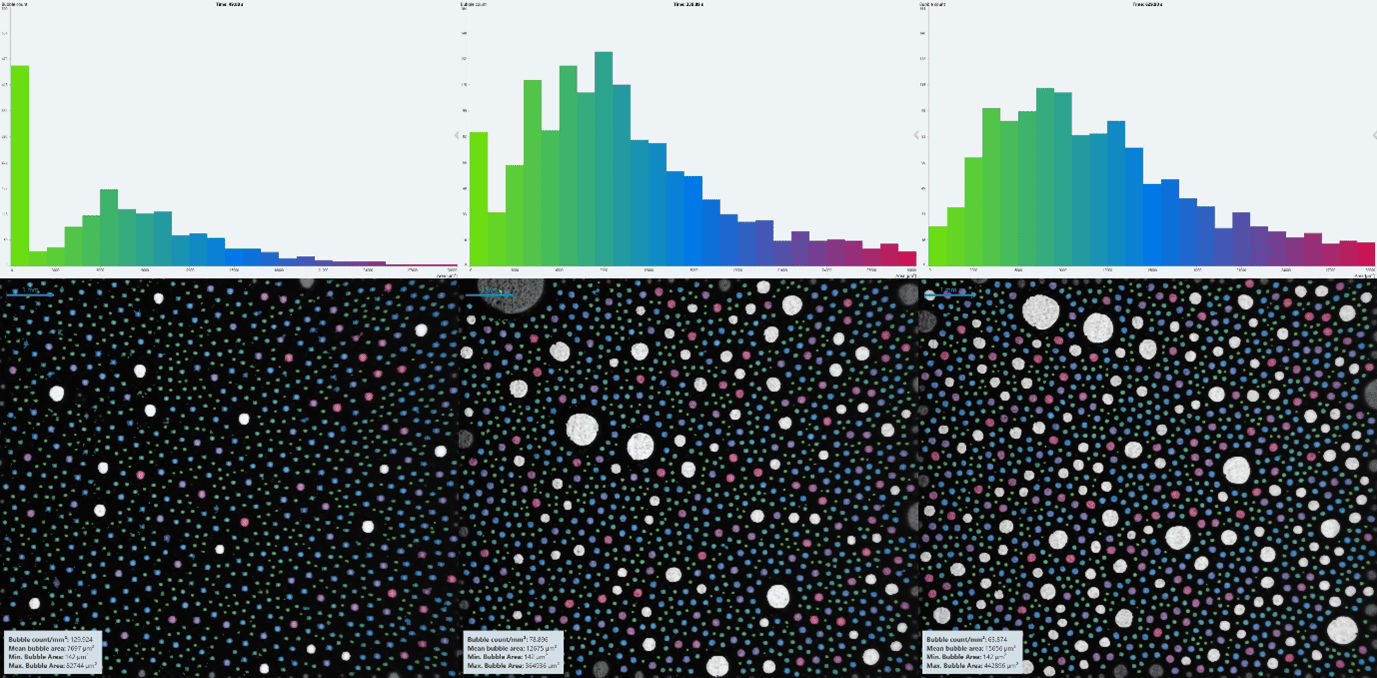
The foam from Shampoo B [Fig. 6] had a much higher proportion of the smallest bubbles initially, compared to the rest. This could be due to the range and bins being much larger than those of Shampoo A, however. As time progressed, the smallest bubbles continued to dominate, though at much lesser bubble counts, and larger bubbles became more prevalent.
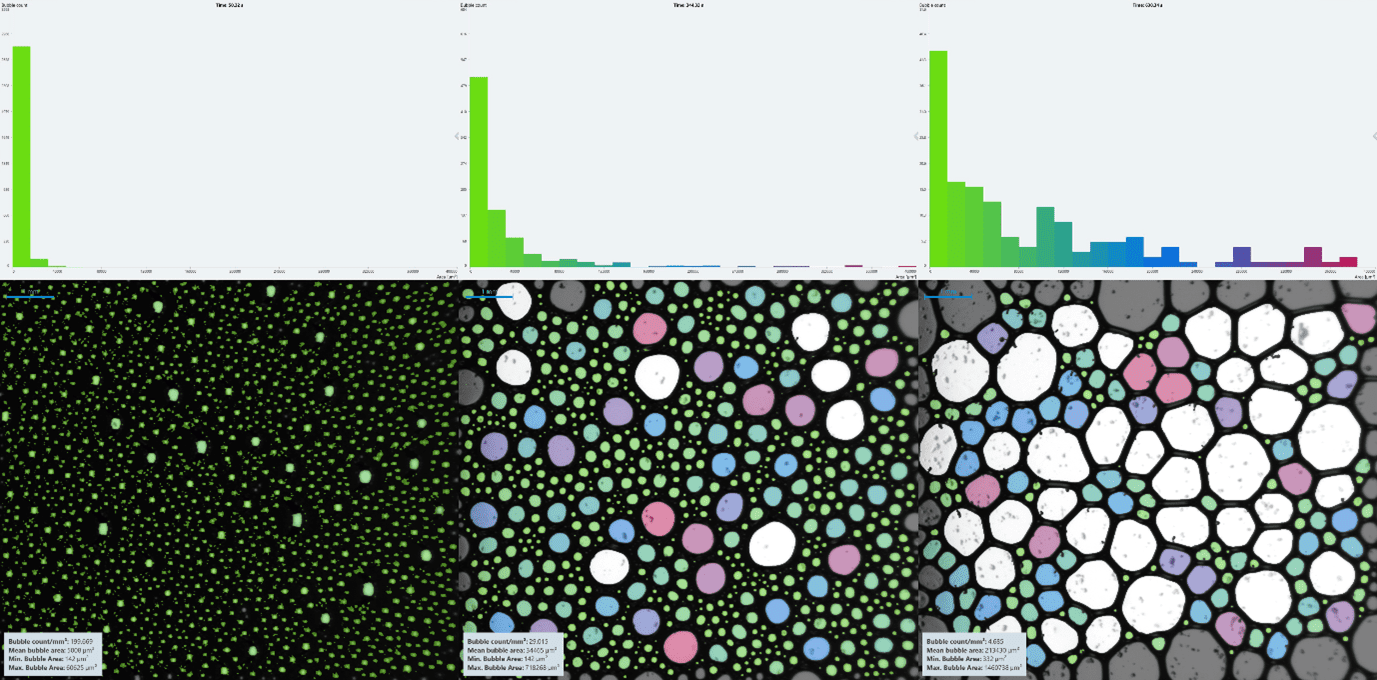
Overall, it is clear from the structural images that Shampoo A produced a more stable, consistent foam, whereas Shampoo B afforded a less stable foam.
Conclusions
In summary, we performed foam analysis on two shampoo samples and compared them at two concentrations. The market-leader Shampoo A produced a foam more stable to drainage and bubble agglomeration/ripening at both concentrations. The cheaper, supermarket own-brand Shampoo B produced a less stable foam at both concentrations. From foam drainage studies, it was determined that concentration had a noticeable effect on foam stability of the two shampoos, with Shampoo A more stable at a higher concentration, and Shampoo B more stable at a lower concentration.

Comparative studies like this can be useful in benchmarking samples against effective/current formulations or competitor products and can help reduce the need for sensory panels.
For further information about these tests or the range of tests that we offer, please contact our experts today
Related Articles:
Brush, Foam, Repeat: Not without Interfacial Rheology!
Baby Bubble Baths and the Interfacial Rheology of Surfactants