If you’re currently using a viscometer to characterise materials, it may be time to consider levelling up your understanding of your products and those of your competitors. This could be particularly so if you are working with structured liquids: effectively semi-solids that only flow on the application of sufficient stress.
At the Centre for Industrial Rheology, one of our most popular services is providing “Rheology Snapshots” for our customers’ materials, capturing comprehensive but easy-to-interpret insights to support formulation development or process design. With the advent of easy-to-use, entry-level rheometers, the benefits delivered from rheology snapshots, and deeper rheological profiles, on structured liquids, are becoming more accessible.
Whether you want to submit samples for advanced testing, develop methods tailored to your formulations, or explore training and support, we can help you unlock the depth of insights a rheometer can offer.
Both viscometers and rheometers are used to characterise materials; however, they differ significantly in the depth of information they provide. To demonstrate these differences practically, we selected three everyday structured, paste-like samples to test.
- Smooth Peanut Butter
- American Mustard
- Chocolate Spread
This study aimed to explore whether a rheometer truly offers greater material insights over a viscometer when analysing complex, real-world materials.

Viscometer Testing Results and Practical Limitations
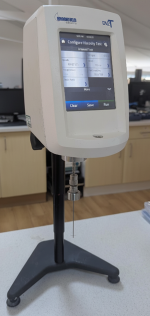
Viscometers are commonly used to measure viscosity: a liquid property. They work by rotating a spindle or probe and measuring the resistance offered by the material through measurement of torque, from which viscosity is calculated. Viscometers are inherently limited in terms of the information they can provide, and whilst measurements can be made at multiple speeds, most users only take a single viscosity reading at a defined rpm.
Viscometers are ostensibly simple, low-cost instruments. However, their apparent simplicity belies the complexity encountered when measuring semi-solids. Two particular limitations of viscometers are the unsuitability of viscometer spindles for measuring highly structured, non-Newtonian materials and the severely limited torque range of the instrument.
The standard Brookfield-style “disk” spindles often prove unsuitable for highly structured materials as, on insertion, the spindle leaves a hole within the sample, resulting in incomplete contact with the spindle surface. The alternative approach is to employ the T-bar and Helipath accessory, where the spindle carves a helical path through undisturbed sample. It should be noted that the viscosity obtained in this way is far from a “true” viscosity. Instead, it is merely a measure of the resistance encountered by the spindle in its path through the sample.
The ten-to-one torque range of the viscometer (100% maximum, down to 10% minimum) is a significant limitation of the viscometer. While measuring across the three samples tested, upper and lower torque limits were frequently encountered, resulting in error messages. Identifying a suitable spindle and speed combination that comfortably sits within the range of the instrument can be a time-consuming and uncertain process.

The t-bar method is notorious for delivering erratic results, so for our testing, multiple measurements had to be taken and averaged. The results are shown in Figure 1. Note, viscosity is reported in Pascal seconds (Pa.s). 1 Pa.s = 1000 centiPoise (cP).

This single viscosity value can be valuable for quality control purposes. For example, if you are manufacturing a paste-like product, it’s important to know that its viscosity consistently falls within a predefined specification range. However, for a deeper understanding of a material’s behaviour, such as how it flows during mixing or pumping, or how it behaves once it is spread, viscometry alone is not enough.
Rheometer Testing Results and Deeper Material Insights

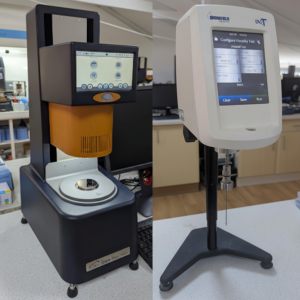
Where a viscometer gives a single number, a rheometer builds a complete picture. It doesn’t just measure a single viscosity point; it shows how a material behaves under differing conditions. Unlike the viscometer, which required trial and error to work, the rheometer was simpler to use. For our study, each sample was loaded on the same geometry, and the instrument ran without error messages, torque issues, or configuration changes.
Rheometers require a significantly smaller sample volume, from as little as 1mL. This small sample size is highly conducive to excellent temperature control, allowing the sample to reach a uniform temperature in seconds. In contrast, the larger sample volumes required by viscometers pose significant challenges for temperature control. Due to the lack of convection, it is difficult to eliminate hot spots and achieve a uniform temperature throughout the entire sample before testing.
Huge Torque Range x Oscillatory Measurements
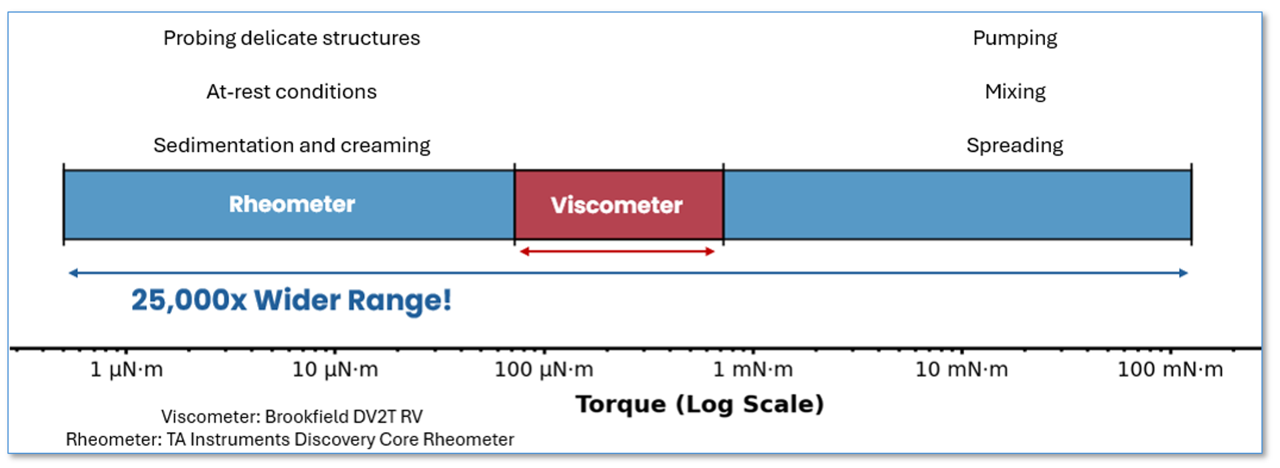
By far the biggest differentiator between viscometers and rheometers is the potent combination of the vast torque range of the latter, and its ability to gently push and release a sample to measure structure and viscoelasticity.
The TA Instruments Discovery Core Rheometer, an entry-level instrument, boasts a torque range that is around 25000 X greater than that of a typical viscometer. In other words, rather than having to change the spindle when torque drops below 10%, you could work down to around 0.0004%!
The wide torque range, coupled with small amplitude oscillation measurements, where a sample is gently nudged and probed, rather than trashed by a rotating spindle, brings two huge benefits:
- The ability to measure delicate structures that impart stability, texture, and coating properties.
- The high torque performance enables the shear of many applications, coating, and pumping processes to be replicated.
We ran simple Rheology Snapshots to demonstrate the rheometer’s capabilities:
Shear Rate Sweep – Viscosity Across a Range of Shear Rates
Viscosity can change based on the shear rate applied. This is the result of non-Newtonian behaviour, with many materials exhibiting such behaviour. A shear rate sweep, or flow curve, characterises how a material behaves across a range of shear conditions. This includes low shear rates, which reflect the material at close-to-rest conditions, to higher shear rates that simulate conditions experienced during spreading or pumping. The data we obtained clearly highlighted this range.

Compared to the single values from the viscometer, these curves reveal the “full story” of how a product flows under differing shear conditions.
Thixotropy Testing: Breakdown and Recovery Timescales
Thixotropy refers to time-dependent viscosity changes following either the application or cessation of shearing. Paste-like samples often display thixotropic behaviour as their viscosity drops during spreading, mixing, or pumping, and then slowly recovers at rest. Measuring this thixotropic response provides insights into how these samples respond to breakdown and how long they take to recover.

Oscillatory Measurements: Structure and Yield Stress
Many materials, such as the pastes in this study along with suspensions, emulsions, and gels, are better described as soft solids rather than liquids when they are at rest or under low stress. This is due to these products having a delicate internal structure that provides rigidity. Viscosity is a liquid property, and viscometers must actively break down this structure to obtain a measurement. The rigidity and strength of this structure, however, are critical properties that deliver important processing, handling, and sensory attributes.
Oscillatory rheological methods are used to probe this delicate structure. These methods involve applying small oscillatory deformations to a sample. This can be thought of as gently wobbling the sample to observe how its structure responds to increasing oscillatory stress.
A key variable derived from this method is the complex modulus, which describes a sample’s overall resistance to deformation. This is essentially the rigidity of the sample. Figure 9 shows the typical output of an oscillatory rheological test.

Smooth peanut butter exhibited the highest complex modulus across the stress range tested, indicating a higher resistance to deformation. All samples exhibit a decrease in modulus at higher stresses, approaching a yield point. This is the stress required to make a material flow.
Summary
Our results make the distinction clear. A viscometer can be an excellent tool for quality control, where the goal is to verify if the same product falls within a set specification. For routine checks to ensure batch-to-batch consistency, a single viscosity value can be both quick and effective.
However, when it comes to formulation development or gaining a deeper understanding of how a product behaves, a rheometer is the tool of choice. From shear-dependent behaviour to structural insights, a rheometer provides a more in-depth picture that is simply not accessible from a viscometer alone.
For those only familiar with viscometry, rheology can initially seem complex and potentially daunting, but it doesn’t have to be. We make rheology simple, accessible, and practical.