
 Oscillatory and capillary rheology are well-established but underutilised methods for screening polymers, offering a route to address concerns about recyclate quality. Recent work from the University of Manchester, published in Nature Communications, has built on the standard oscillatory rheological approach to reveal new insights into thermal and oxidative degradation and provide a quantitative measure of how far a polymer feedstock has degraded [1].
We have coupled these established methods with these new insights to create a simple toolkit, so that structure, stability, and processability can all be assessed. Three questions, three measurements and clear insights on whether a feedstock is ready for your process. We run the tests, analyse the data and explain what it means for your polymers.
The Cost of Finding Out on The Line
An MFI certificate is where the cheap decisions end, and the expensive ones can start. Challenges include:

Established methods, new insights, one simple toolkit
Virgin resin exhibits a consistent molecular weight and one-pack additive package; however, recycled polyolefin carries the wear and tear of its previous lifecycle. Thermal degradation from past processing, incomplete optical and density sorting, and wash-line remnants like pigments, mineral fillers, and adhesives all combine to disrupt the polymer’s structure, directly altering how the melt behaves through the die.
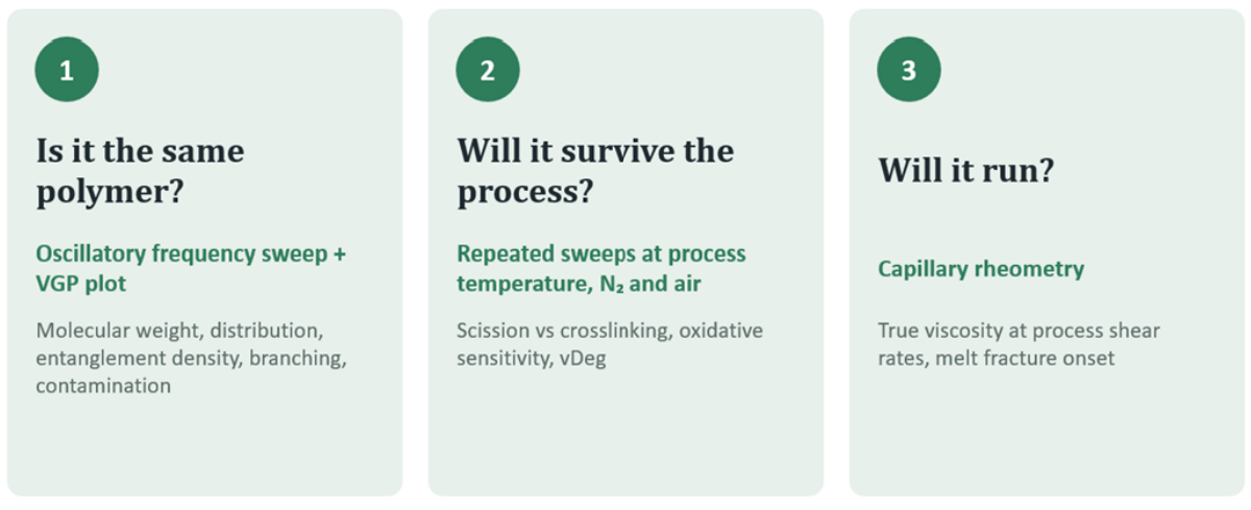
By benchmarking the recyclate’s rheological fingerprint directly against its virgin baseline, we reveal the subtle flow and structural differences that dictate whether it will perform as desired in your process. Instead of simply answering whether a batch vaguely matches an incoming specification, our sustainable polymer screening toolkit breaks the equivalence challenge down into three decisive, measurable questions.
Is it the same polymer?
Utilising oscillatory rheological profiling, we can obtain a comprehensive structural fingerprint backed by a range of useful metrics.
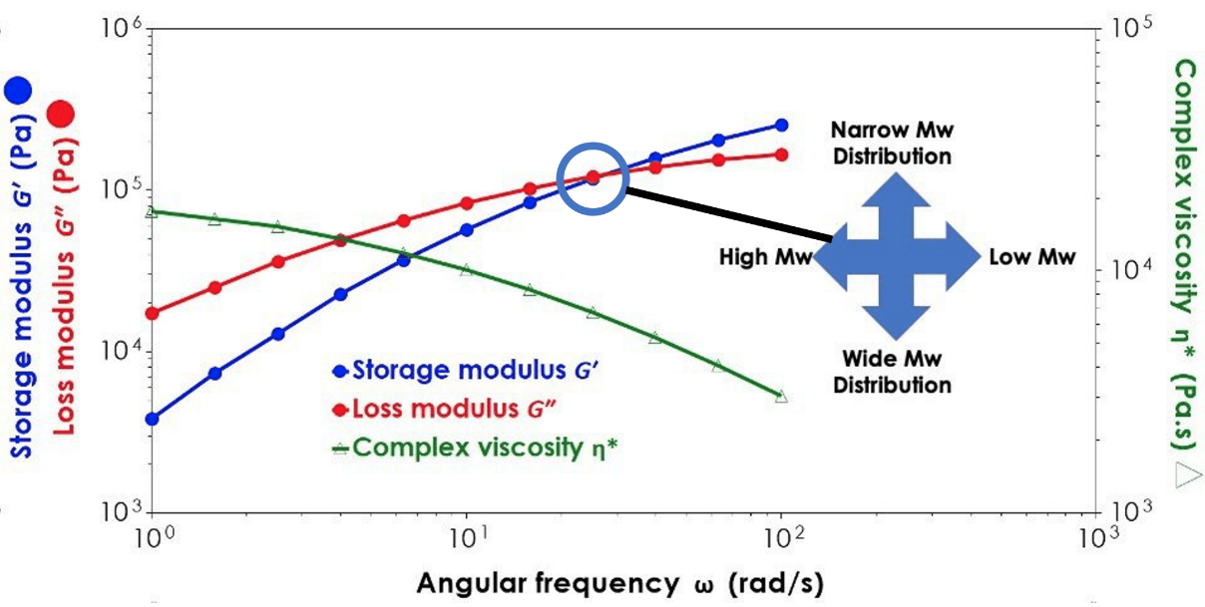
The zero-shear viscosity and crossover frequency can be used to track relative molecular weight. The crossover modulus itself indicates the breadth of the molecular weight distribution, with a lower modulus indicating a broader molecular weight distribution. The storage plateau modulus can be used to gain insight into entanglement density. As the entanglement density is fixed by the polymer’s molecular structure, any baseline shift flags a different comonomer, a foreign polymer, or filler loading rather than degradation.
Will it survive the process?
Holding the melt at processing temperature during realistic residence times reveals whether its viscosity will drift in the barrel. Running this test under an inert nitrogen blanket isolates oxidative breakdown, whilst repeating the test in air uncovers sensitivity to oxidation, which can expose a spent antioxidant package.
For example, polyethylene’s viscosity and elasticity increases as thermal crosslinking occurs, while polypropylene’s viscosity falls and its crossover frequency shifts up as it goes through chain scission.
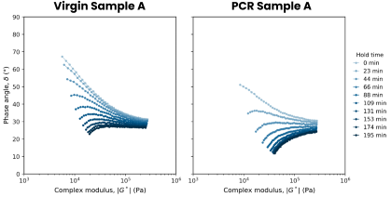
Plotting the data on a van Gurp-Palmen plot removes the frequency and temperature axes so that molecular structure can be compared directly. Long-chain branching shifts the curve to lower phase angles; polydispersity flattens it; and an immiscible contaminant, such as PP, in an HDPE stream can produce a distinct shoulder due to dispersed droplets relaxing on their own timescale.
This change can be quantified as a single comparative degradation metric (Vdeg), taken as the gradient of the phase angle with respect to complex modulus, with both values taken over the frequency range of 0.31-3.1 rad s-1. This degradation metric provides a quantitative value to monitor the degradation of a polymer throughout the measurement and can be normalised to present the results on a 0-100 scale.
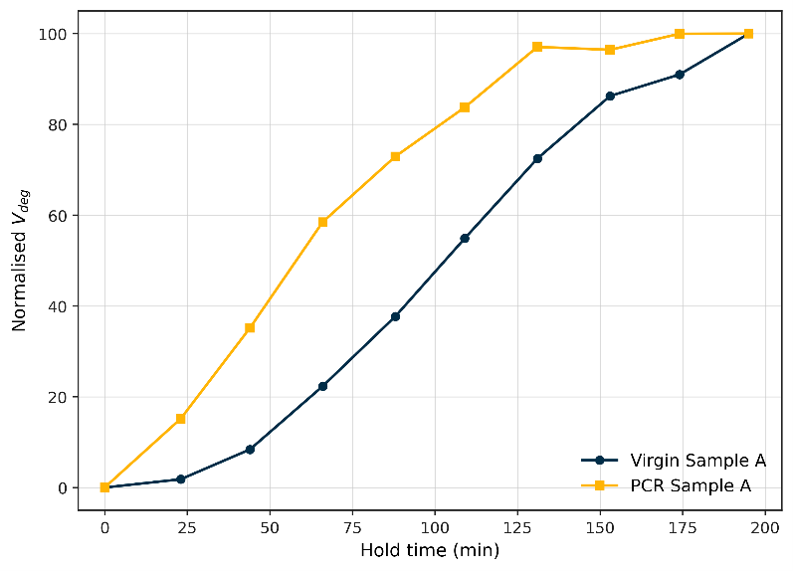
A curve that stays flat for longer before it begins to climb will have more flexibility in processing. Specifically, it means it can absorb more thermal and shear history before its structure changes significantly. The gap between the two curves along the time axis will tell you how much more processing one feedstock will tolerate than another. Knowing your own residence time and processing temperature, you can set the threshold a feedstock has to clear rather than judging it by a grade alone.
Will it run?
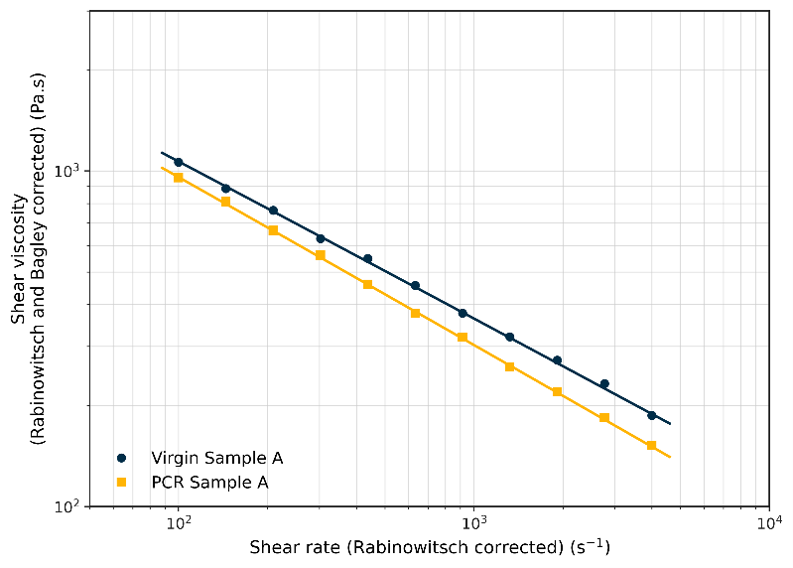
While the melt flow index can be a useful quality control tool that is quick and easy to perform, it is fundamentally a single-point measurement that is unable to capture the high-shear behaviour inherent in industrial polymer processing. A standard melt flow index test typically subjects polymer melts to low shear rates of up to 10 s-1, whereas industrial polymer processes can go beyond even 105 s-1. Capillary rheology allows us to extend the flow curve into this high-shear regime to capture viscosity at conditions representative of polymer processing.
By applying Bagley corrections for entrance pressure and Rabinowitsch corrections for non-Newtonian flow, we are able to obtain the material’s true shear viscosity.
Summary
Navigating recyclate polymers shouldn’t mean gambling on material behaviour during real processing conditions. Our sustainable polymer screening toolkit cuts through the uncertainty. By pairing oscillatory and capillary rheological profiling, we convert complex flow dynamics into clear, implementable insights. You provide the material; we handle the testing, data analysis and interpretation required to turn recyclate validation from a trial-and-error risk into data-backed decisions. Get in touch to benchmark your recyclates before they are used in your process.
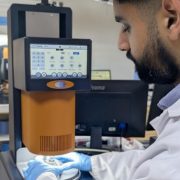
Wasif Altaf serves as an Applications Specialist at the Centre for Industrial Rheology, leveraging a chemical engineering background (BEng) to bridge theory and practice. His work focuses on advanced rheological characterisation.
References
[1] – Patel AD, Schyns ZO, Franklin TW, Shaver MP. Defining quality by quantifying degradation in the mechanical recycling of polyethylene. Nature Communications. 2024 Oct 9;15(1):8733.