
 Thanks for scanning our poster at SEPAWA 2026. As you saw on the poster, day-one rheology identified the most stable of two fabric conditioners, Lenor Outdoorable and Comfort Fresh, and a twelve-month shelf study validated the results.
When it comes to predicting stability, our rheology toolkit is the most powerful tool we commonly utilise. However, at the Centre for Industrial Rheology, we have far more than just rheometers. We put the same two products through four further techniques to see what extra insights we could exploit. All measurements in this extended study were done on fresh samples.
If you would like to discuss the content on the poster or anything in this extended study, contact us
Zeta potential: electrostatic repulsion
 Zeta potential measures the charge at the surface of dispersed particles, droplets or vesicles, and so how strongly they repel one another. The usual rule of thumb is that a magnitude above 30 mV, positive or negative, means good electrostatic stability. Below that, particles drift together and flocculate or coalesce.
Concentrated products make analysis of zeta potential tricky. Neat fabric conditioners are opaque, so light scatters several times before it reaches the detector and the signal is lost. Therefore, to capture zeta potential measurements, dilution is required. To capture an accurate zeta potential, it is preferable to dilute with the external phase of the product and track pH to ensure it stays the same. It is also valid to dilute products in the same way and then treat the analysis as a relative comparison between products. For this study, all products were diluted in tap water and measured on our Malvern Zetasizer Advance Ultra Red at 1% and 10%.
| Sample | Zeta potential magnitude at 1% (mV) | Zeta potential magnitude at 10% (mV) |
|---|---|---|
| Comfort Fresh | +64.8 ± 1.5 | +77.0 ± 3.7 |
| Lenor Outdoorable | +66.4 ± 0.9 | +78.8 ± 2.6 |
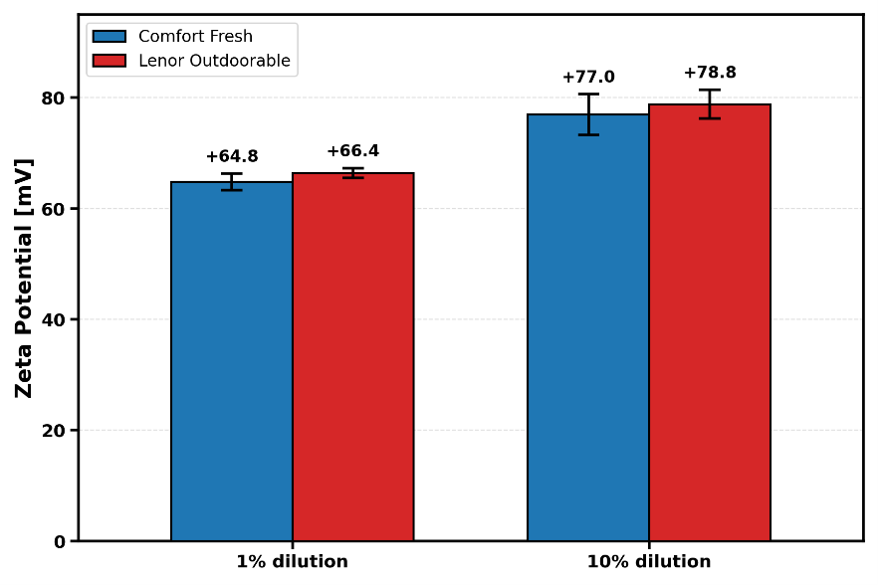
Due to the dilution protocol used in this study, the classic 30 mV stability threshold cannot be applied directly. Instead, evaluations are focused on the relative differences between formulations. The positive values for zeta potential are expected as the cationic surfactants carry a positive charge. While Lenor exhibited slightly higher values across both dilution levels, the differences between the products were not significant. In this case, electrostatic repulsion does not alone provide the complete picture of stability for these products. This underpins the importance of using rheology in combination with techniques such as zeta potential for stability analysis.
Rheo-impedance spectroscopy: a new and exciting technique
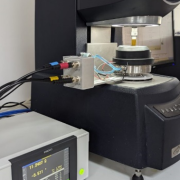
Both labels list 5-15% cationic surfactants but give neither the type nor the amount. Rheo-impedance spectroscopy (Rheo-IS), one of the newest and least exploited techniques in our lab, lets us compare formulations like these without taking them apart.
An alternating electrical field is applied across the sample between the rheometer plates. Charged species, including the cationic surfactant, its counterions, and any added electrolyte, shift and accumulate in response. This is polarisation.

We focus on loss permittivity (ε″), the out-of-phase part of that response, which captures energy dissipated as charge moves. The peak frequency gives a relaxation time (τ = 1/2πf), showing how quickly charge redistributes. The peak’s height and width show how much charge builds up and how many processes overlap. At these frequencies, the signal comes from the movement of mobile ions, which makes it highly sensitive to the formulation’s ionic make-up.
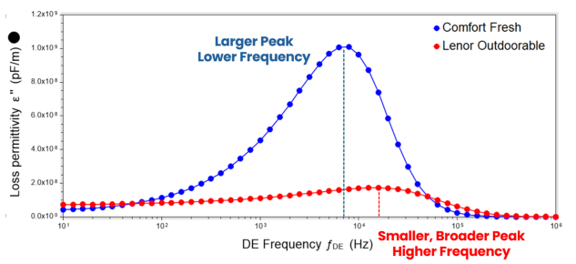
Comfort shows a large peak at around 8 kHz (τ ≈ 20 µs). Lenor’s peak is around six times smaller, broader, and sits at around 16 kHz (τ ≈ 10 µs). Charge in Lenor redistributes about twice as fast, and much less of it builds up, pointing to differences in the type and amount of cationic surfactant, counterions and electrolyte.
The fingerprint obtained is the real value from rheo-impedance spectroscopy measurements. It can be used as an ultra-sensitive microstructural probe to track batch-to-batch consistency, show the effect of an ingredient or supplier change or even benchmark against a target or competitor.
Bubble pressure tensiometry: insights into surfactant kinetics
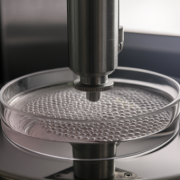 While surface tension is mostly quoted at equilibrium, dynamic processes like a washing machine rinse cycle continuously create fresh interfaces. In these cases, performance is not only governed by the final equilibrated value, but also by how quickly surfactant molecules migrate to newly formed interfaces. Utilising our bubble pressure tensiometer, we can resolve dynamic surface tension at surface ages as short as 5 milliseconds. This timescale is well beyond the reach of optical techniques such as pendant drop analysis, which typically captures a measurement from a second onwards.
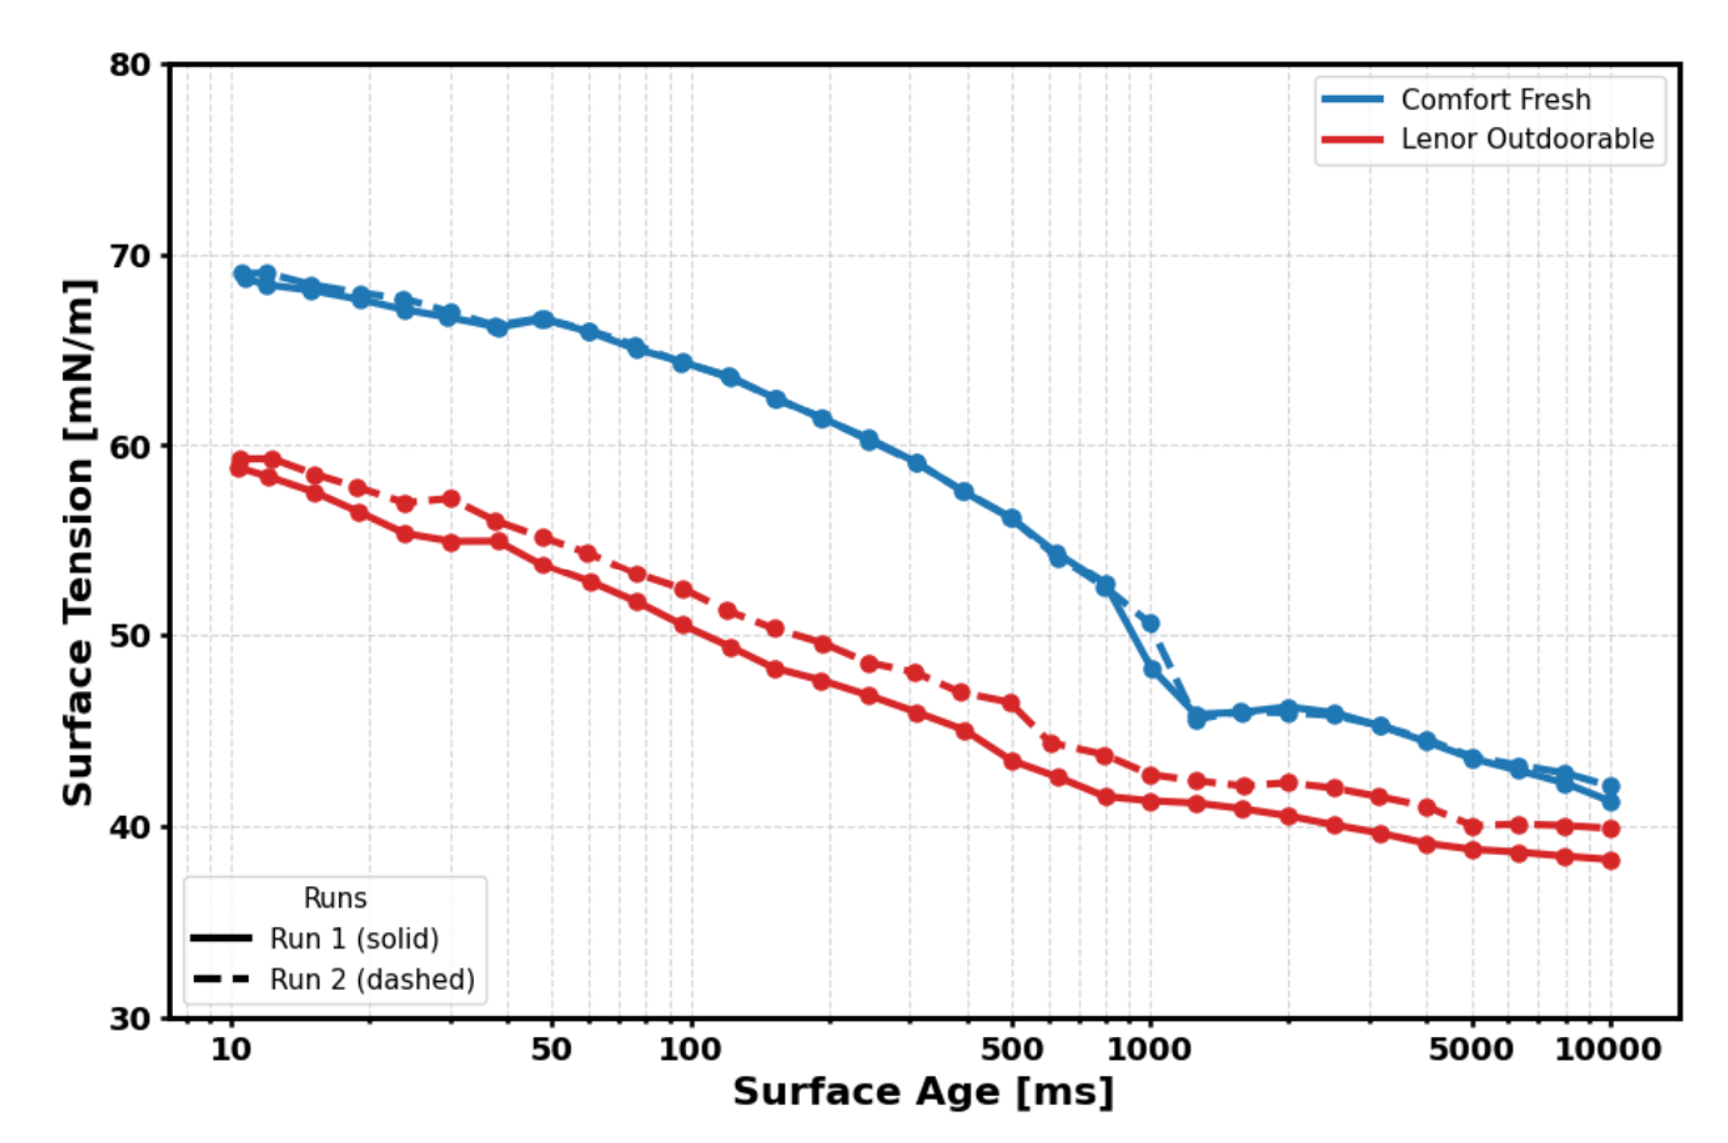
At 10 ms, Comfort sits at around 69 mN/m, while Lenor is already down to 59 mN/m. By one second, the gap shrinks to a few mN/m. A conventional measurement at one second or later would make these products look far more alike than they are, masking these key differences that occur in the first fractions of a second. This early kinetic window dictates rapid wetting and spreading, which is essential for fabric conditioners as they rely on uniform surface coverage to effectively deposit a conditioning layer of cationic surfactants onto fabrics. This further highlights the significance and extra insights gained when obtaining dynamic surface tension measurements.
Interfacial rheology: how robust is the interface?
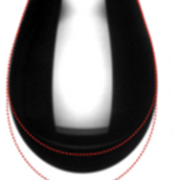
Bubble pressure tensiometry shows how fast surfactants arrive at an interface. Interfacial rheology probes what they build once they are there, measuring the viscoelastic properties of the interface itself. Using the oscillating pendant drop method on our drop shape analyser, the surface of a hanging drop is repeatedly expanded and compressed. Stretching the surface thins out the film of surfactants at the interface and raises the surface tension, and the size of that change gives us the interfacial viscoelastic modulus. Simply, this is a measure of how strongly the interface resists being stretched and compressed.
| Sample | Dilatational viscoelastic modulus (mN/m) |
|---|---|
| Comfort Fresh | ~20 |
| Lenor Outdoorable | ~30 |
Lenor’s viscoelastic modulus sits higher than Comfort’s. Putting this into context with the dynamic surface tension measurements, Lenor’s surfactants reach newly formed interfaces faster and build a tougher interface when they arrive. Robust interfaces help droplets and bubbles resist coalescence. Interfacial viscoelasticity has been linked to foam and emulsion stability across many systems and can be a useful additional technique to probe stability on top of just rheology alone.
Talk to us at SEPAWA
Find us at the SEPAWA Congress 2026, 14 to 16 October at the Estrel Congress Center, Berlin, at booth 570, Convention Hall II, or catch Wasif at the poster session on Wednesday 14 October, 13:00 to 14:30. Can’t make it? Get in touch to see how a multi-technique workflow could shorten your stability testing.

Wasif Altaf serves as an Applications Specialist at the Centre for Industrial Rheology, leveraging a chemical engineering background (BEng) to bridge theory and practice. His work focuses on advanced rheological characterisation